Decorative Ring Decorative Ring Decorative Ring
For Applicants

Your Resume, Translated into an Admissions Strategy

One upload turns your activities into scores, a Tier, and a plan.

See Where You Stand

Five axes, one Tier, zero guesswork

One upload shows where you stand and how to climb.

Get a simple Tier, Top 3 schools, and major fit.

We highlight what's working—and what to add—so every step moves your profile forward.

Resume on clipboard Conversion arrow Evaluation results

Now, see the Full Report in action.

Scan the highlights, dive where it matters.

This is sample data. Your results will vary based on your resume. Use the side notes to see what to expect on each page.

Evaluation Results

Completed in 10 minutes (2 minutes slower than average)
406
out of 490

Tier 2

Strong profile with notable accomplishments in multiple areas

Your Total score reflects performance across five axes, and the Tier places you within a clear band of similar profiles. Read the bars as signals of evidence and impact—longer bars indicate strength, while the shortest one or two show the fastest path to improvement.

Academic
79.2/100
EC/Arts
83.9/100
Athletic
77.7/100
Personal
85.1/100
GPA/Test
80.1/100

Three schools are surfaced for alignment with your profile, each with a concise reason to consider. Use this as a focused starting point, then check the full report for deeper context and nearby alternatives.

Top 3 Recommended Colleges

Based on your profile, these colleges are the best matches for you

#1
Brown University
FIT SCORE
93%
RANK
#13
  • Open Curriculum enables interdisciplinary data & public health studies
  • Swearer Center, Brown Public Health collaboration opportunities
  • Supports community service and music activities simultaneously
#2
Cornell University
FIT SCORE
91%
RANK
#12
  • College of Engineering/Arts & Sciences DS & Statistics track
  • Atkinson Center (sustainability) and other research hubs
  • Orchestra and choir music opportunities
#3
University of Pennsylvania
FIT SCORE
91%
RANK
#11
  • College's Health & Societies, PPE programs linked with DS
  • Civic House & Netter Center for community impact
  • Penn Orchestra and arts activity infrastructure

Strengths

  • Impressive extracurricular engagement demonstrating leadership and commitment
  • Athletic participation showing teamwork and dedication
  • Well-developed personal narrative with clear sense of purpose
  • Excellent academic performance with strong GPA and test scores
  • Profile demonstrates competitive readiness for top-tier institutions

Areas for Improvement

  • Continue building depth in areas of strength
  • Seek opportunities for greater impact and leadership

Strengths show where you stand out on each axis—what to emphasize. Areas for improvement point to what to build or refine to raise your score, move up a Tier, and better align with target colleges.

Once you've scanned the summary, select "View Full Report" for the complete, in-depth breakdown.

Comprehensive Evaluation Report

View your detailed 14-page analysis including personalized college recommendations, strengths assessment, and improvement strategies.

FULL REPORT
Cube Icon

College Admission Strategy Comprehensive Analysis

This first page orients you to the whole report. At the top, you'll see your Total Score, current Tier, and the Target University band that best matches your profile. Use these three markers as the framing for the pages that follow.

The chart on the left shows how your score is distributed across the five axes—Academic, EC/Arts, Athletic, Personal, and GPA/Test. It's a quick way to see which areas contribute most to your overall result and where additional weight could shift your Tier.

On the right, each axis is scored on a 100-point scale with a short label describing the level. Read these bars as evidence and impact: higher bars indicate stronger proof in that category, while lower bars indicate the fastest path to meaningful gains. As you move through the report, you'll see how these signals connect to college recommendations, major fit, and domain-level actions.

Report Sample
Category Analysis Icon

Category Analysis — applies to Academic, EC/Arts, Athletic, Personal, GPA/Test

This page explains how your score in a single category was built. On the left, Main Activities & Evaluation lists the key items from your resume, shows the grade/level we assigned to each, and the score that activity contributed. At the top right, you'll see the category's Final Score, with Base Score + Bonus so you can tell what came from core evidence versus extra impact. The Score Composition chart visualizes which activities drove your result most. At the bottom, the Category Summary translates the data into plain guidance—what's already strong, what's missing at higher levels (e.g., judged/competitive outcomes, leadership, depth), and the most direct next steps to raise this category.

College Recommendations Icon

Top 3 College Recommendations

College Recommendations Report
Surface the three schools most aligned with your profile right now. Treat them as high-quality starting points for research, not guarantees.
The why: specific programs/culture showing how the school fits you (interdisciplinary model, resources, and orientation tag such as S2).
Concrete evidence of fit (programs, centers, tracks, opportunities) linked to your signals. Use these chips to plan next research clicks.
A plain-language summary of the school's standout angle that maps to your strengths and intended themes.
A visual alignment score for quick comparison across the three cards. Higher fit suggests stronger match given your current profile—not an admit prediction.
Context on selectivity and an indicative probability range so you can balance ambition and realism. Use together to current score/Tier.

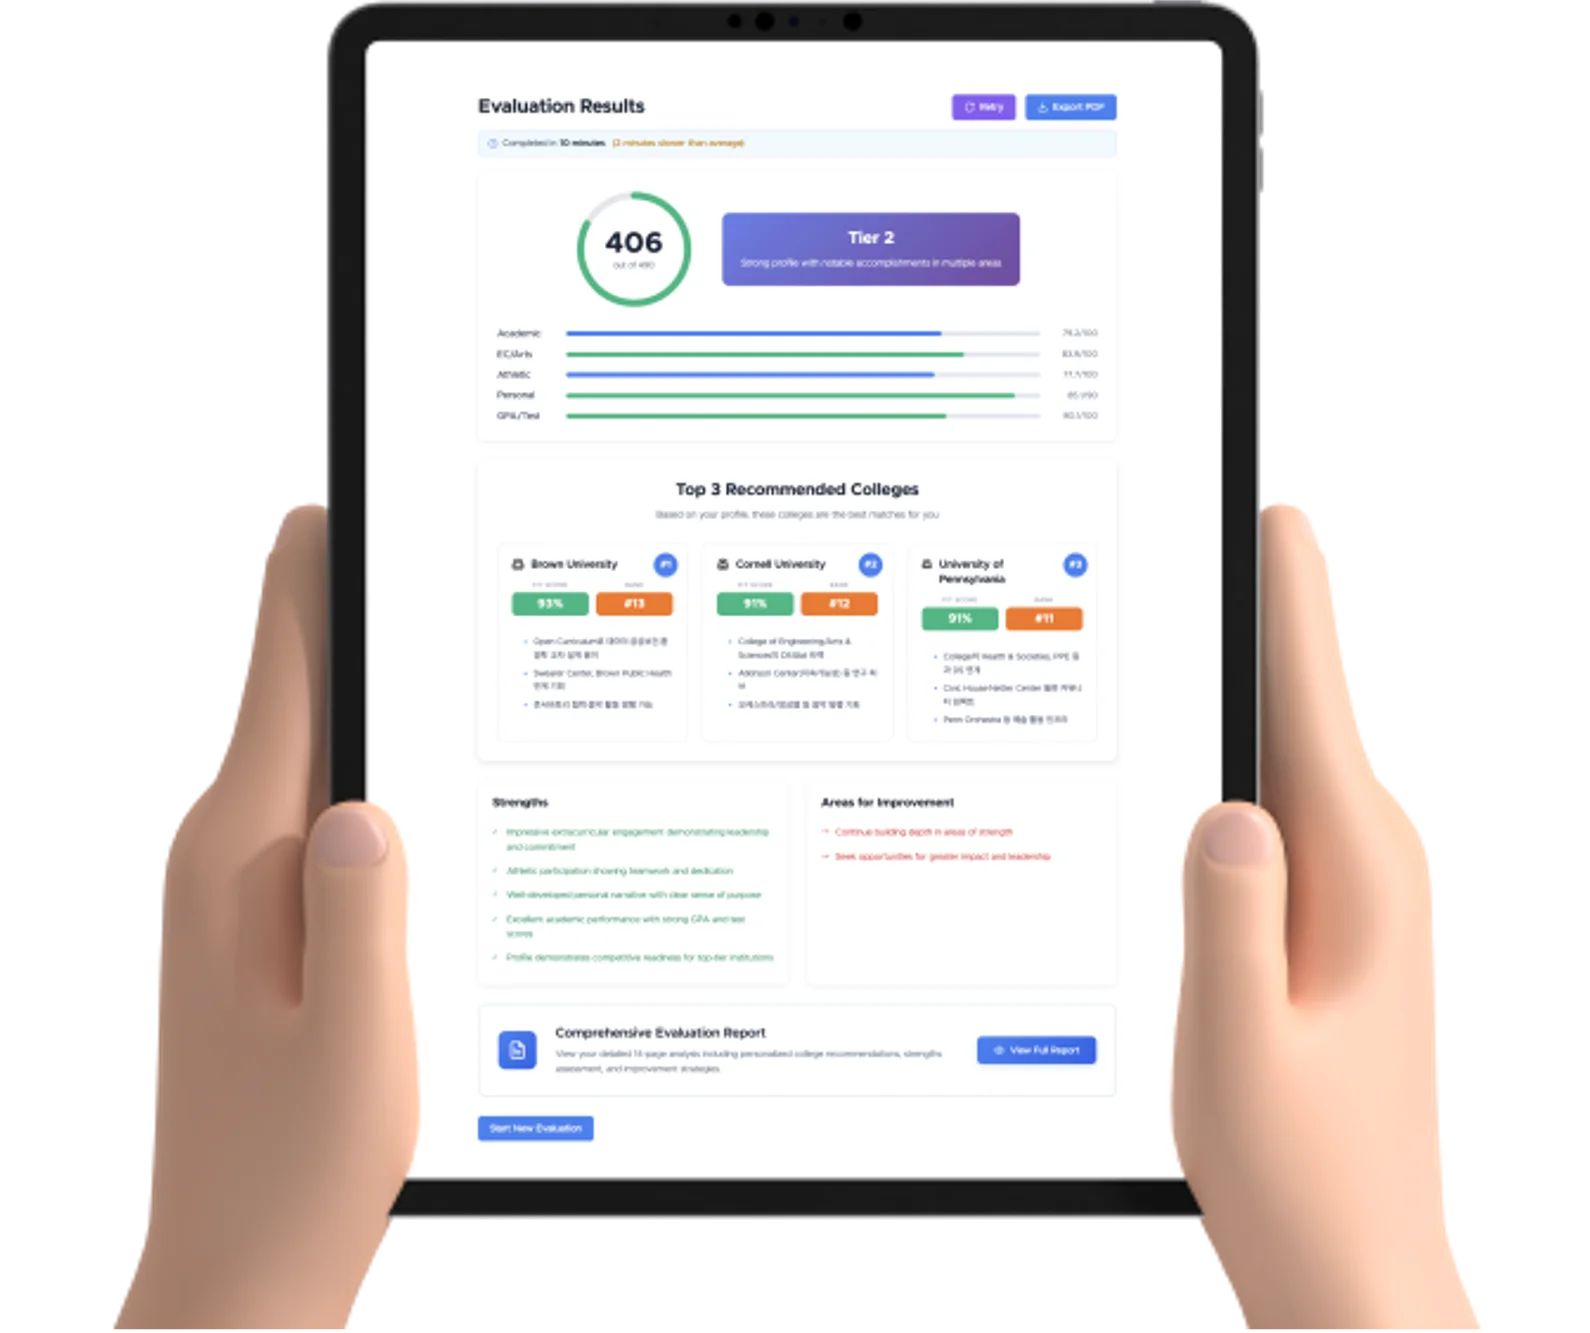
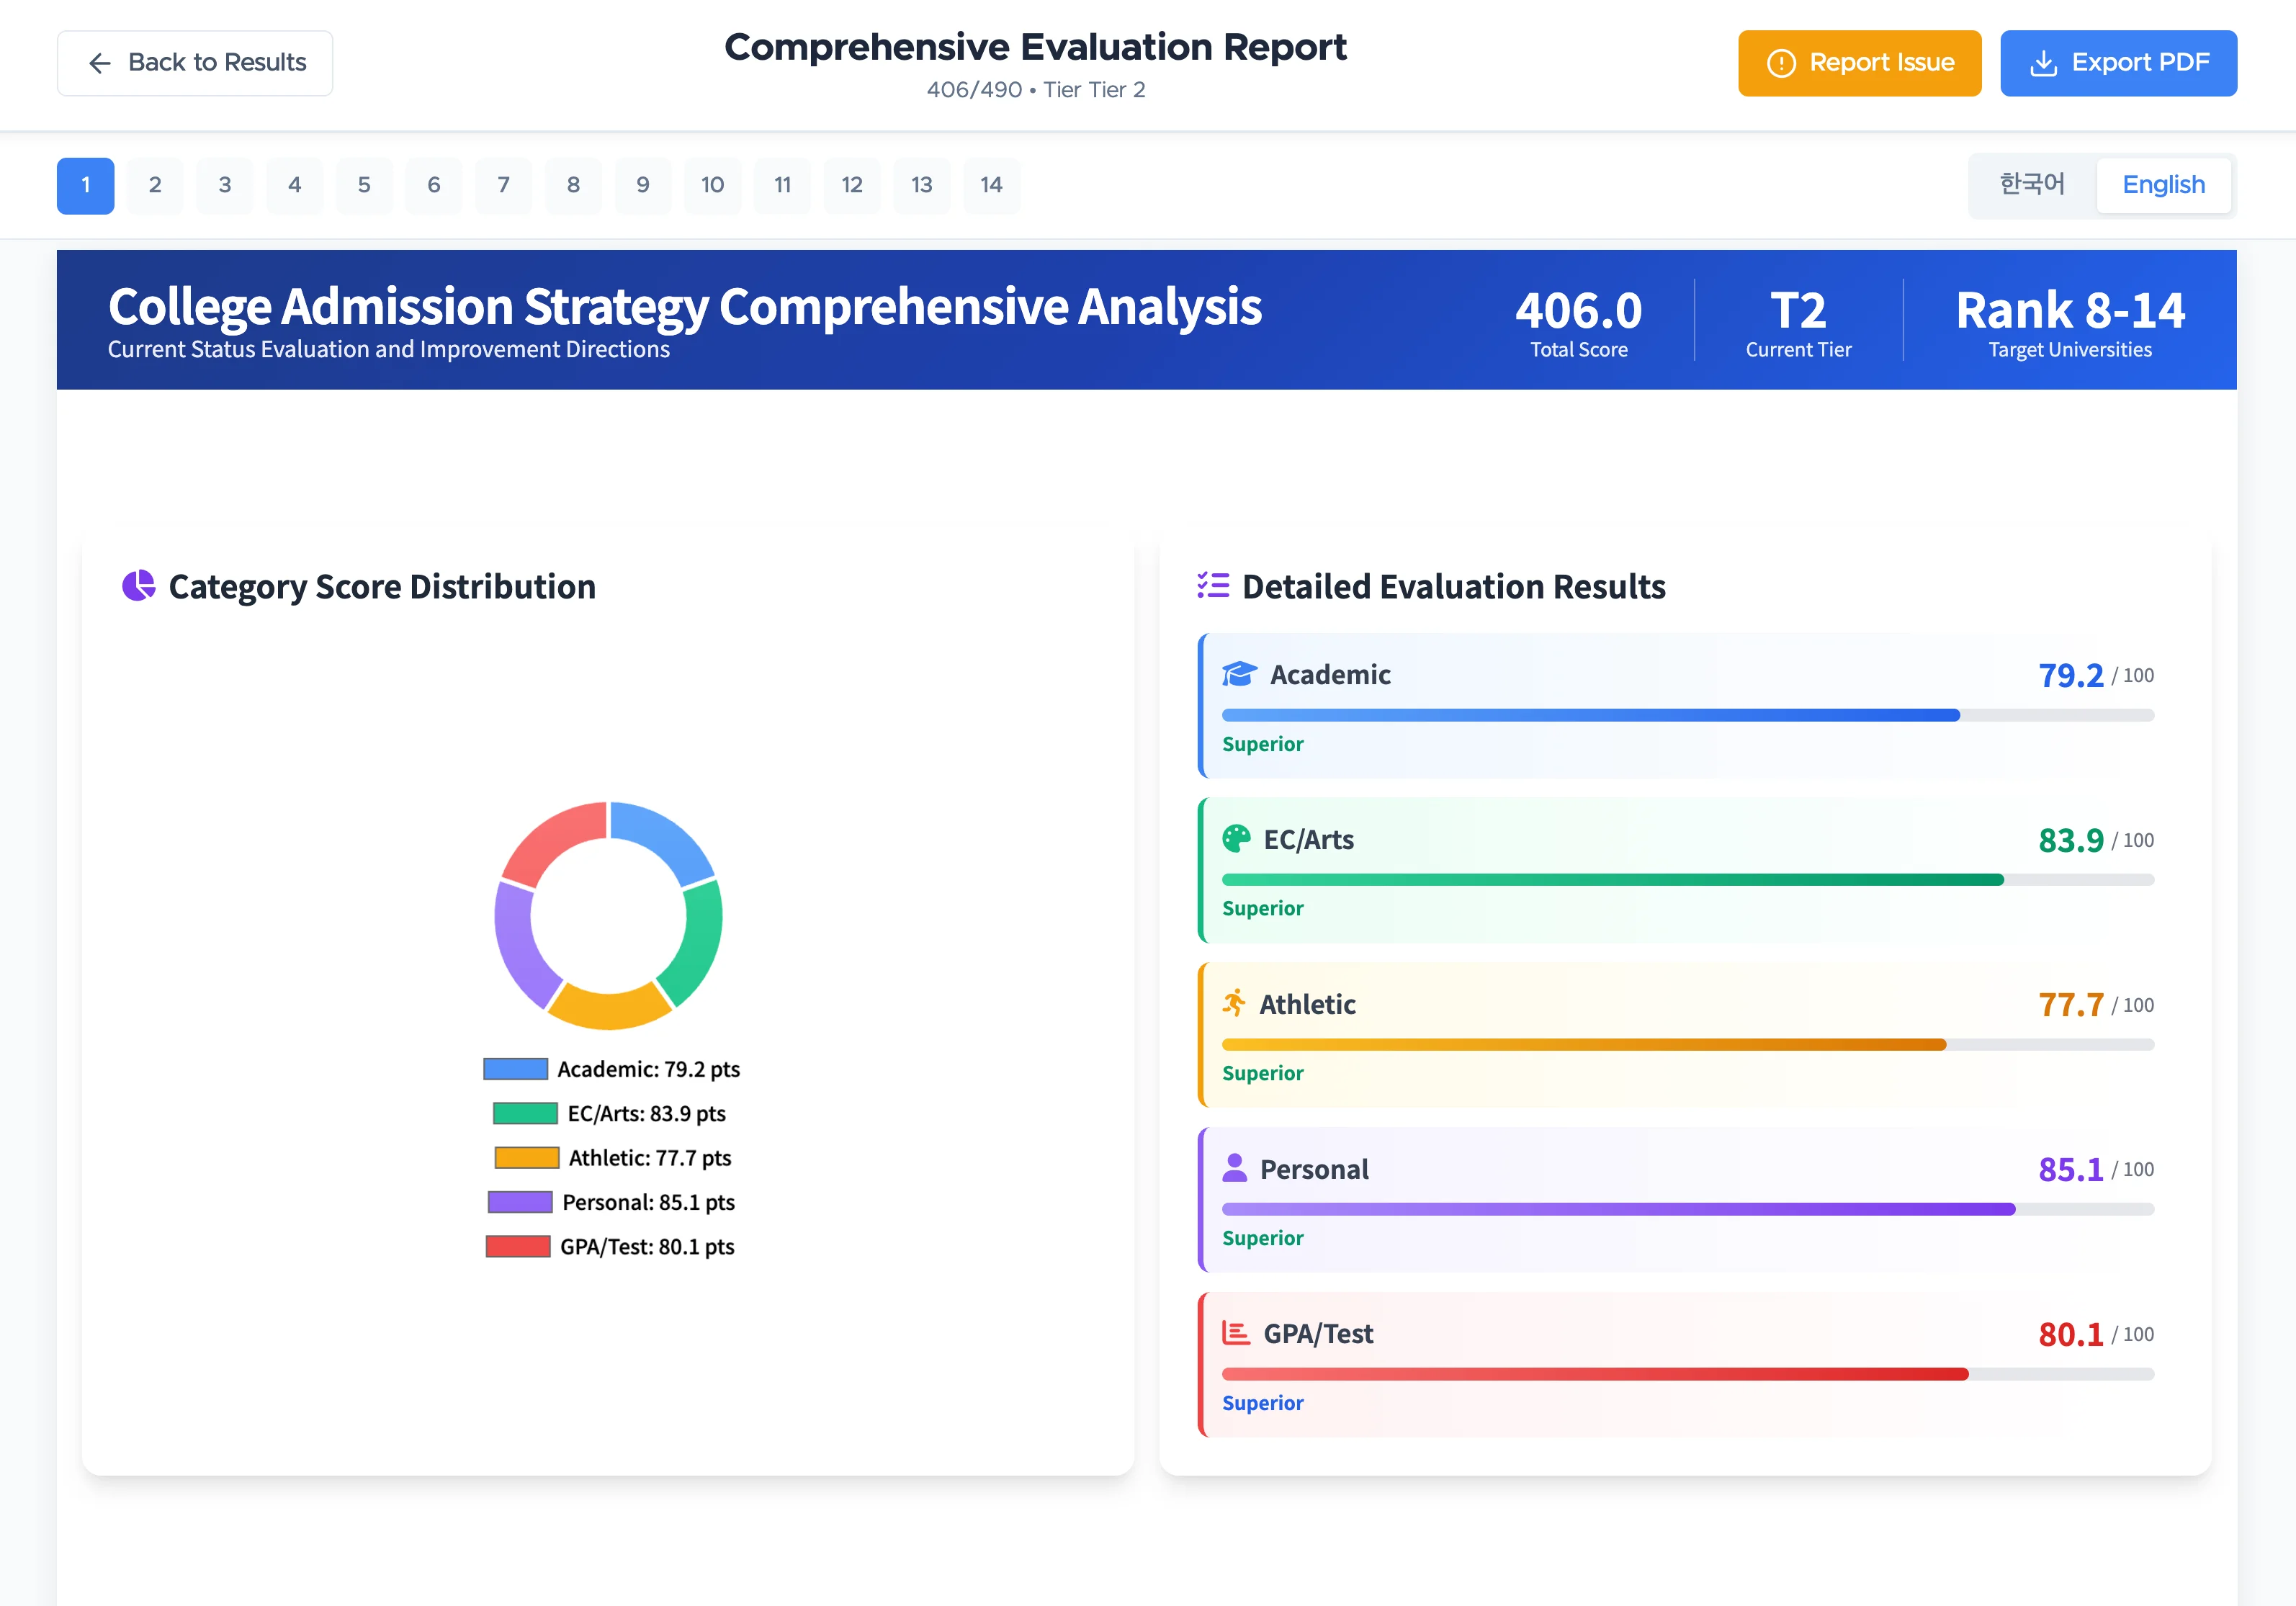
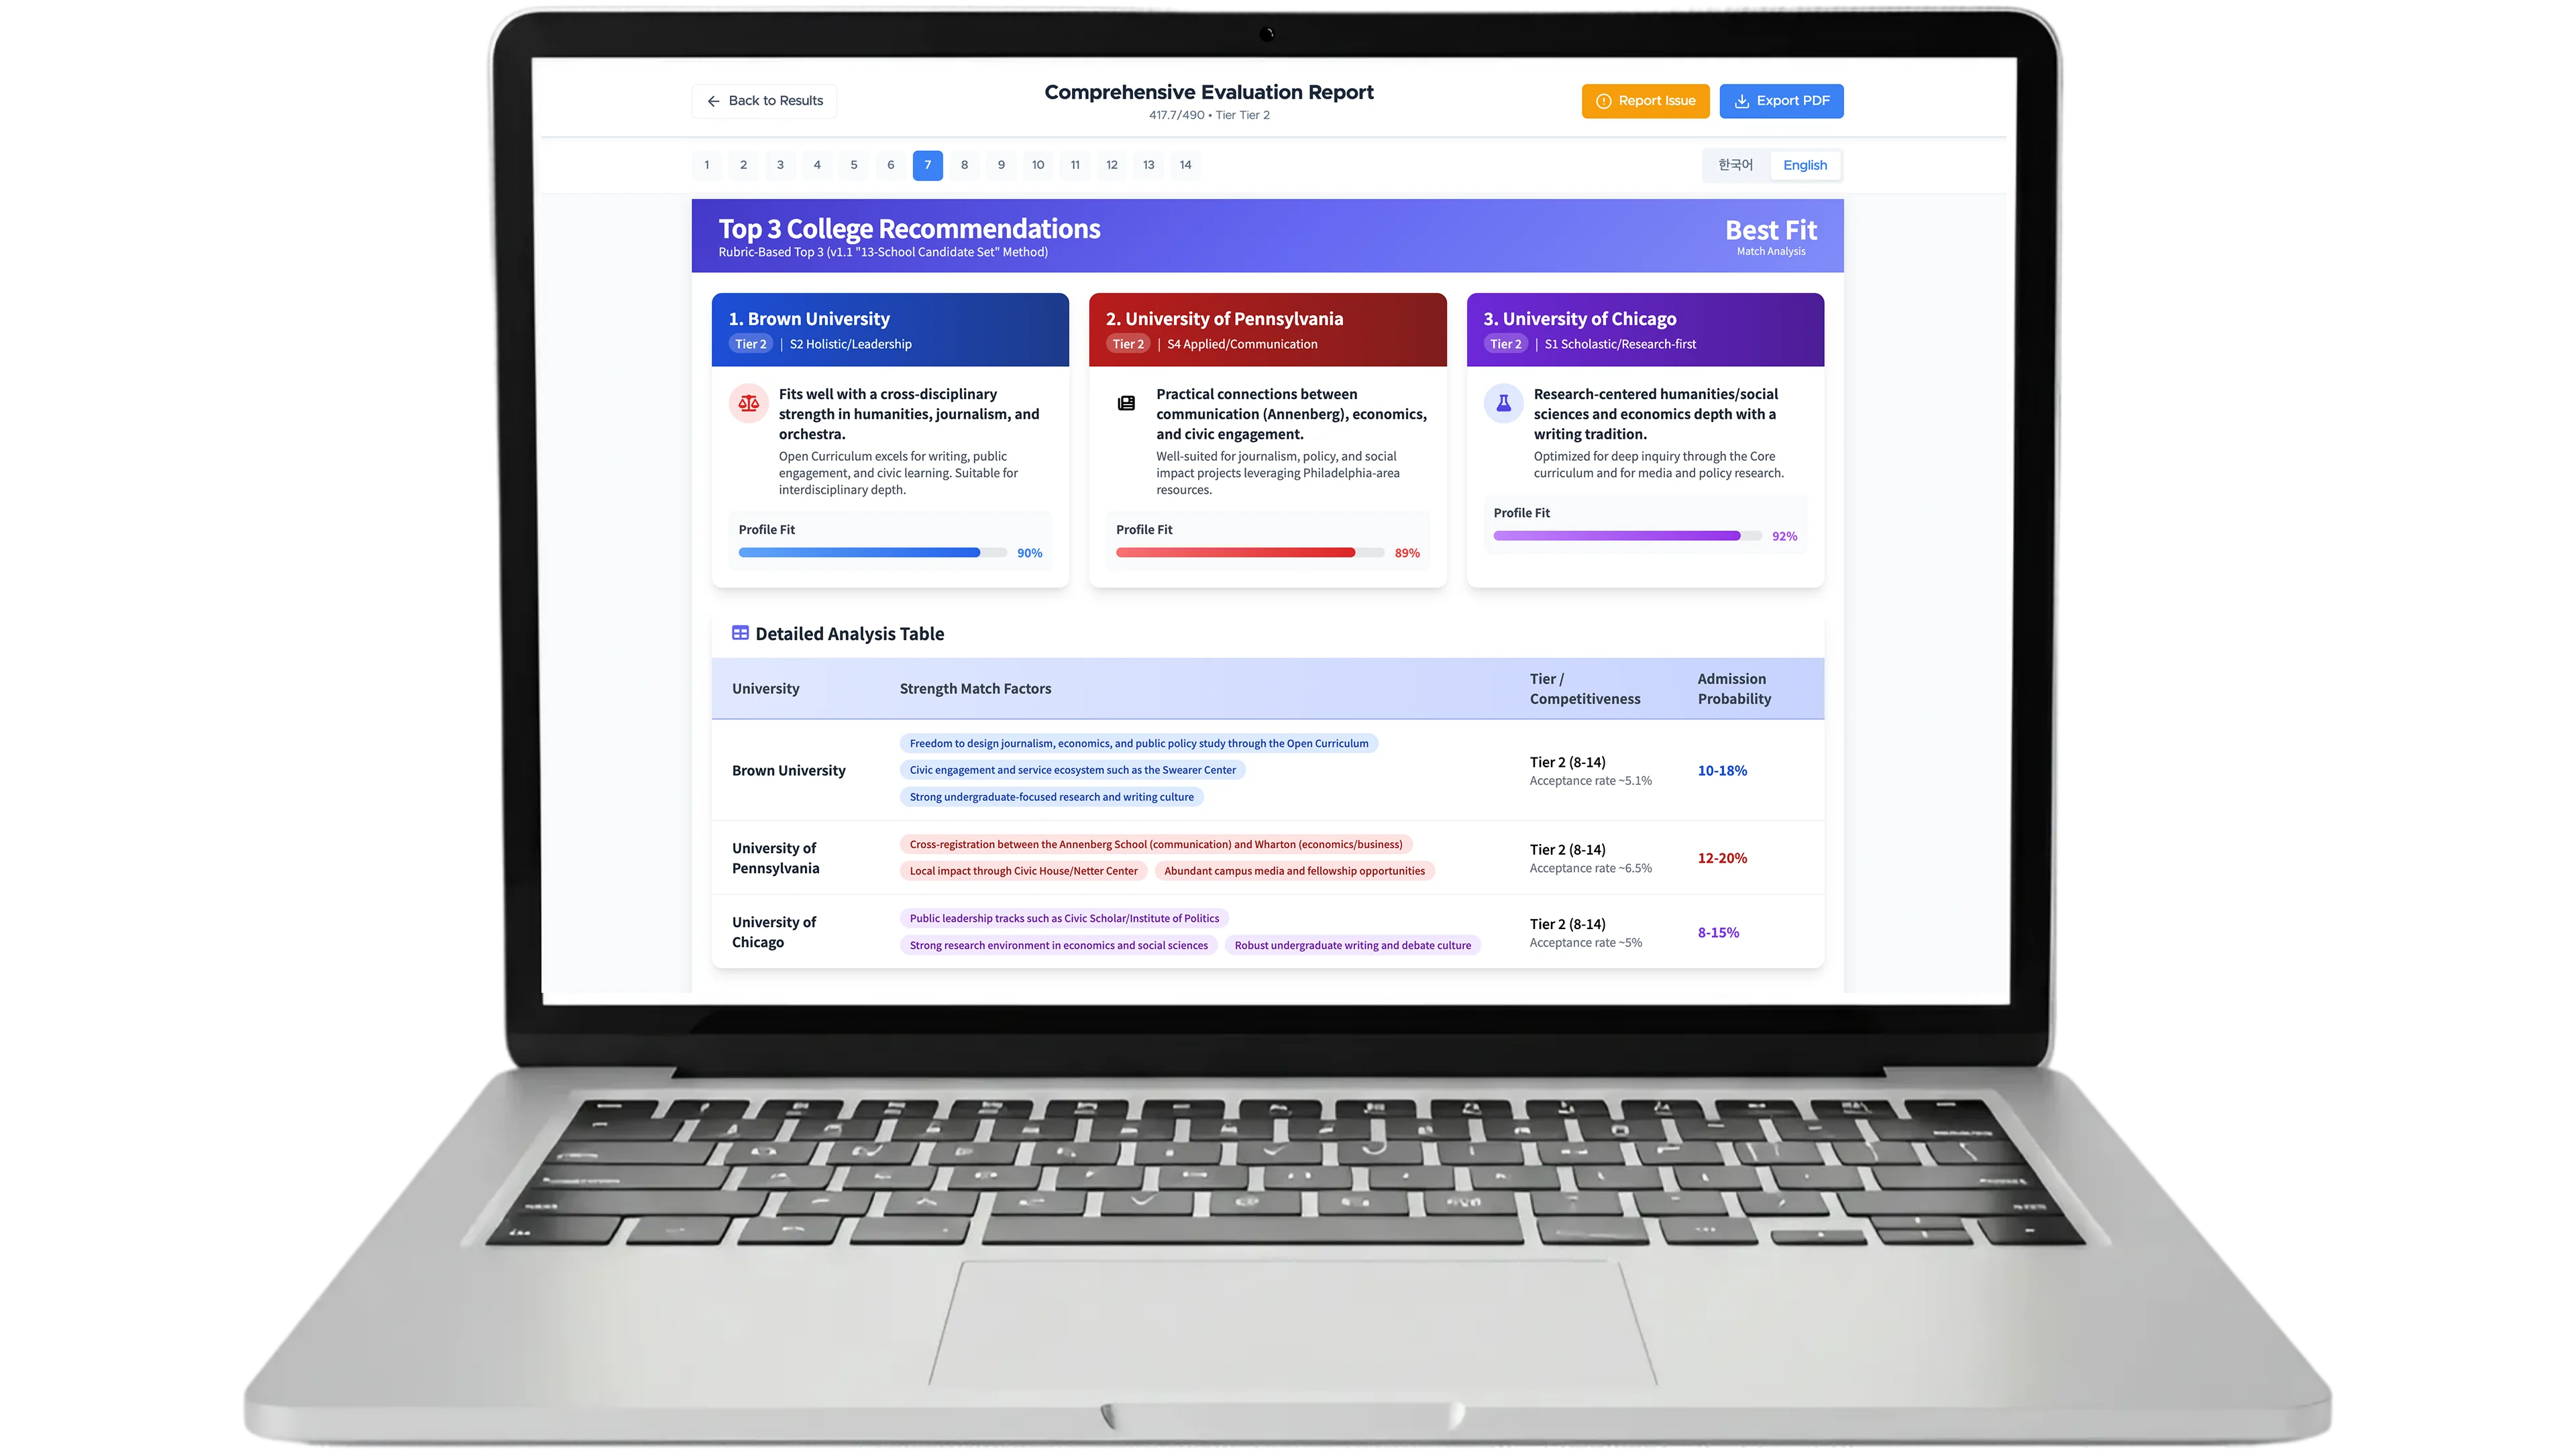
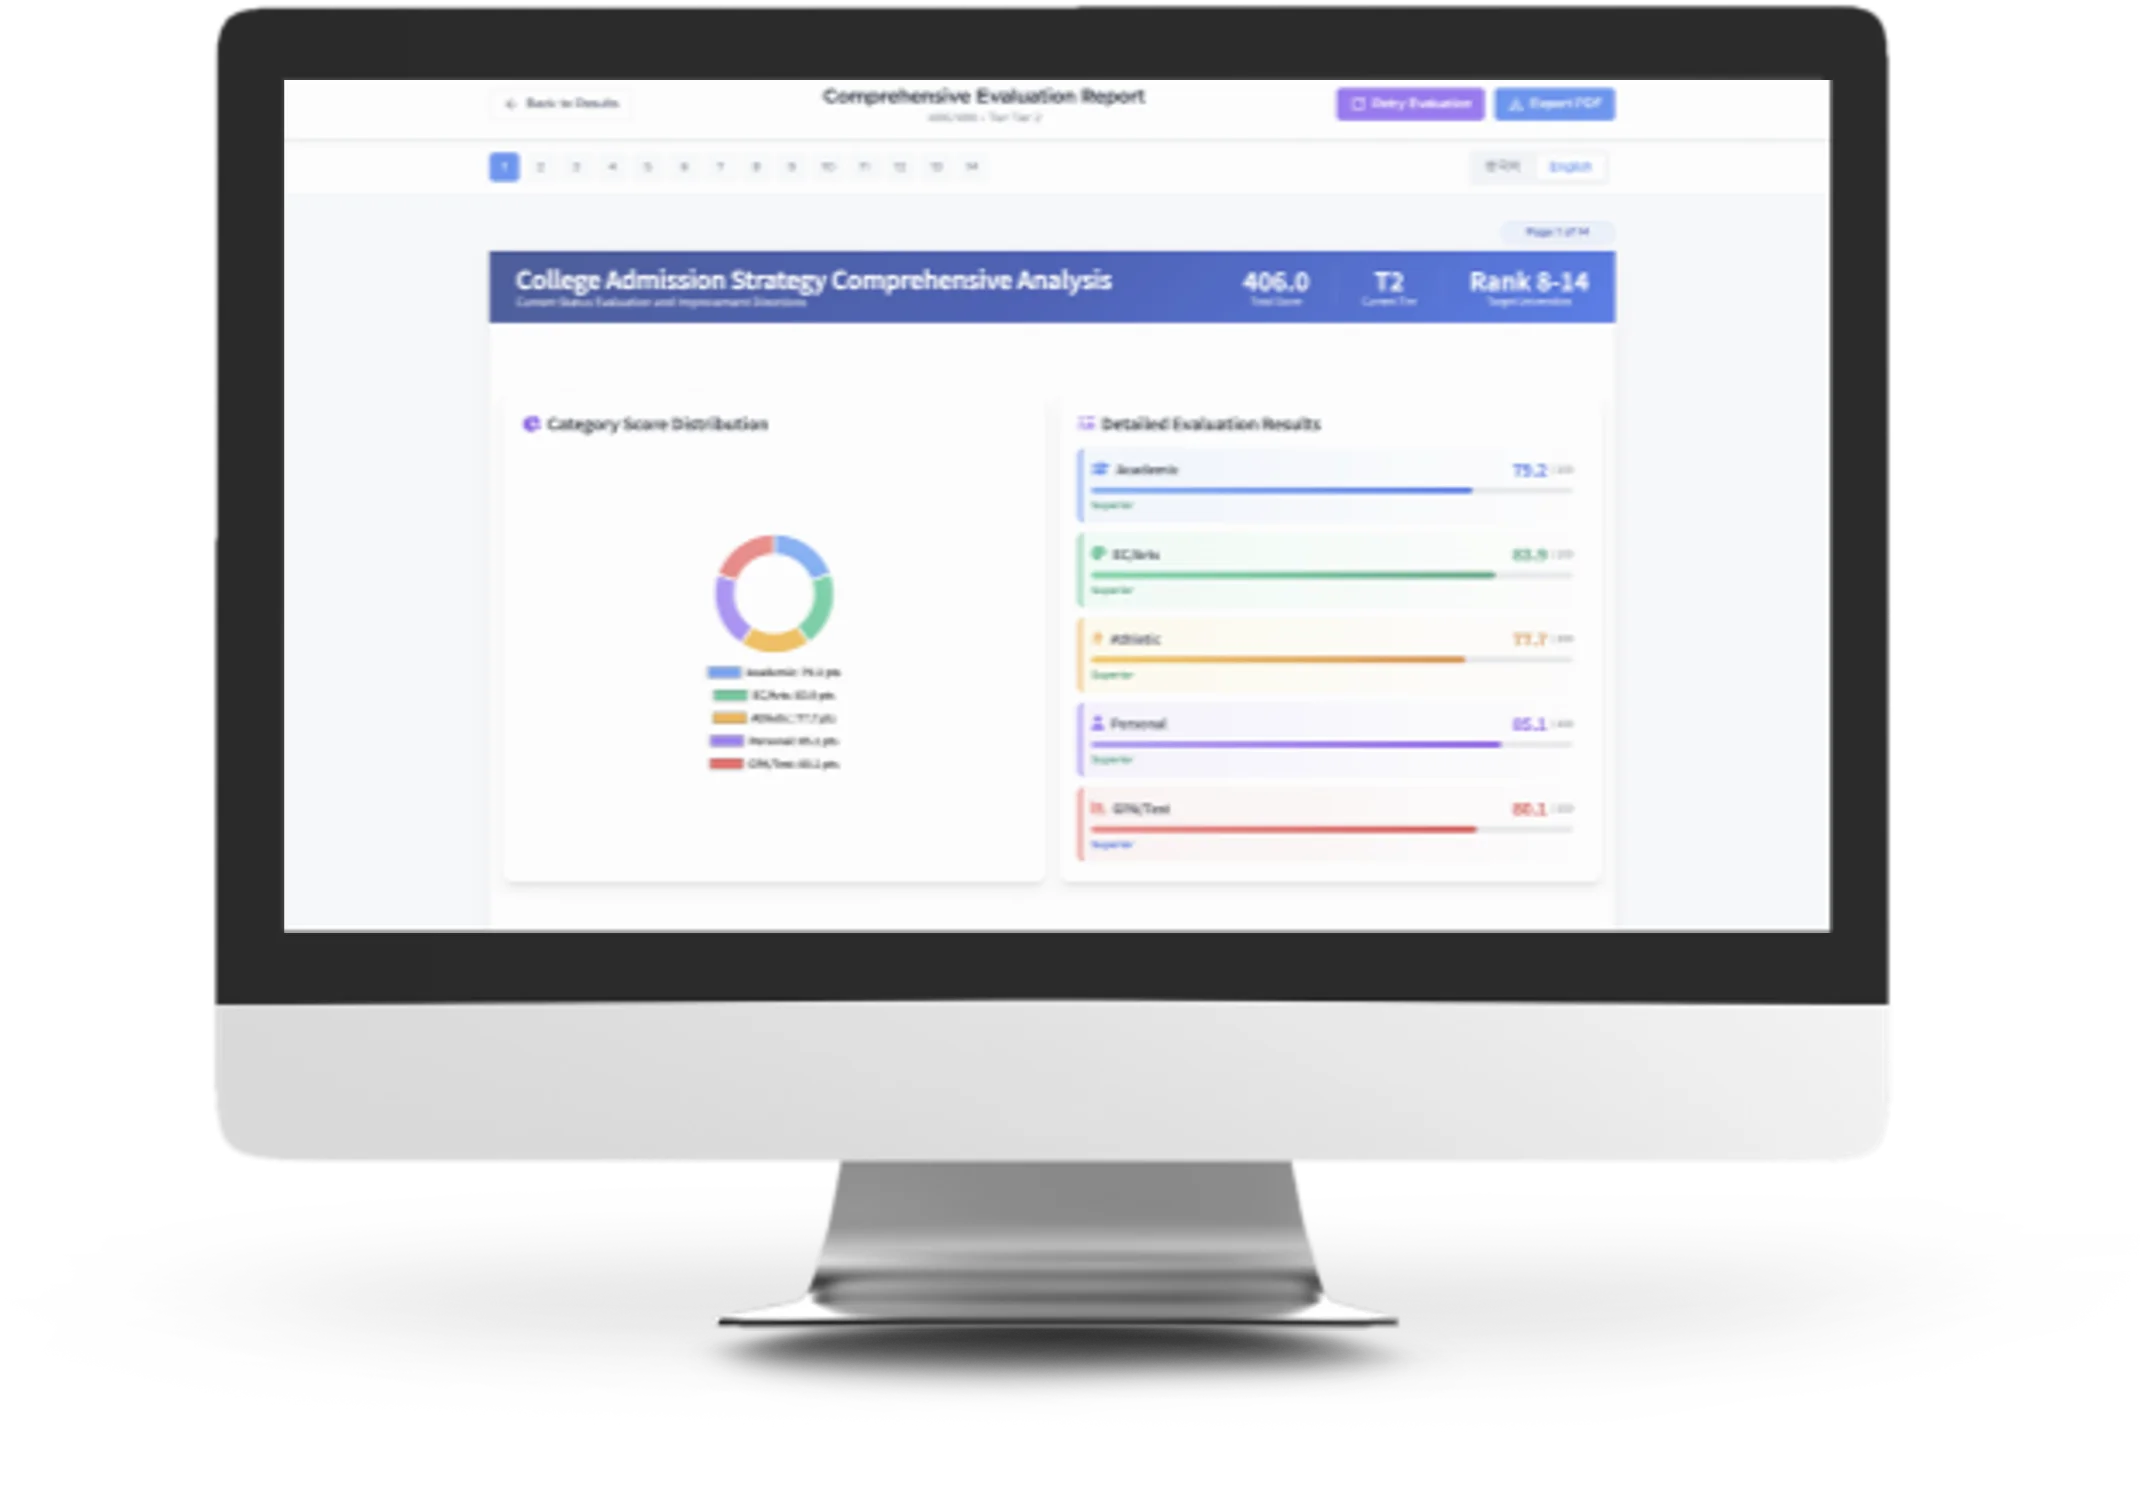
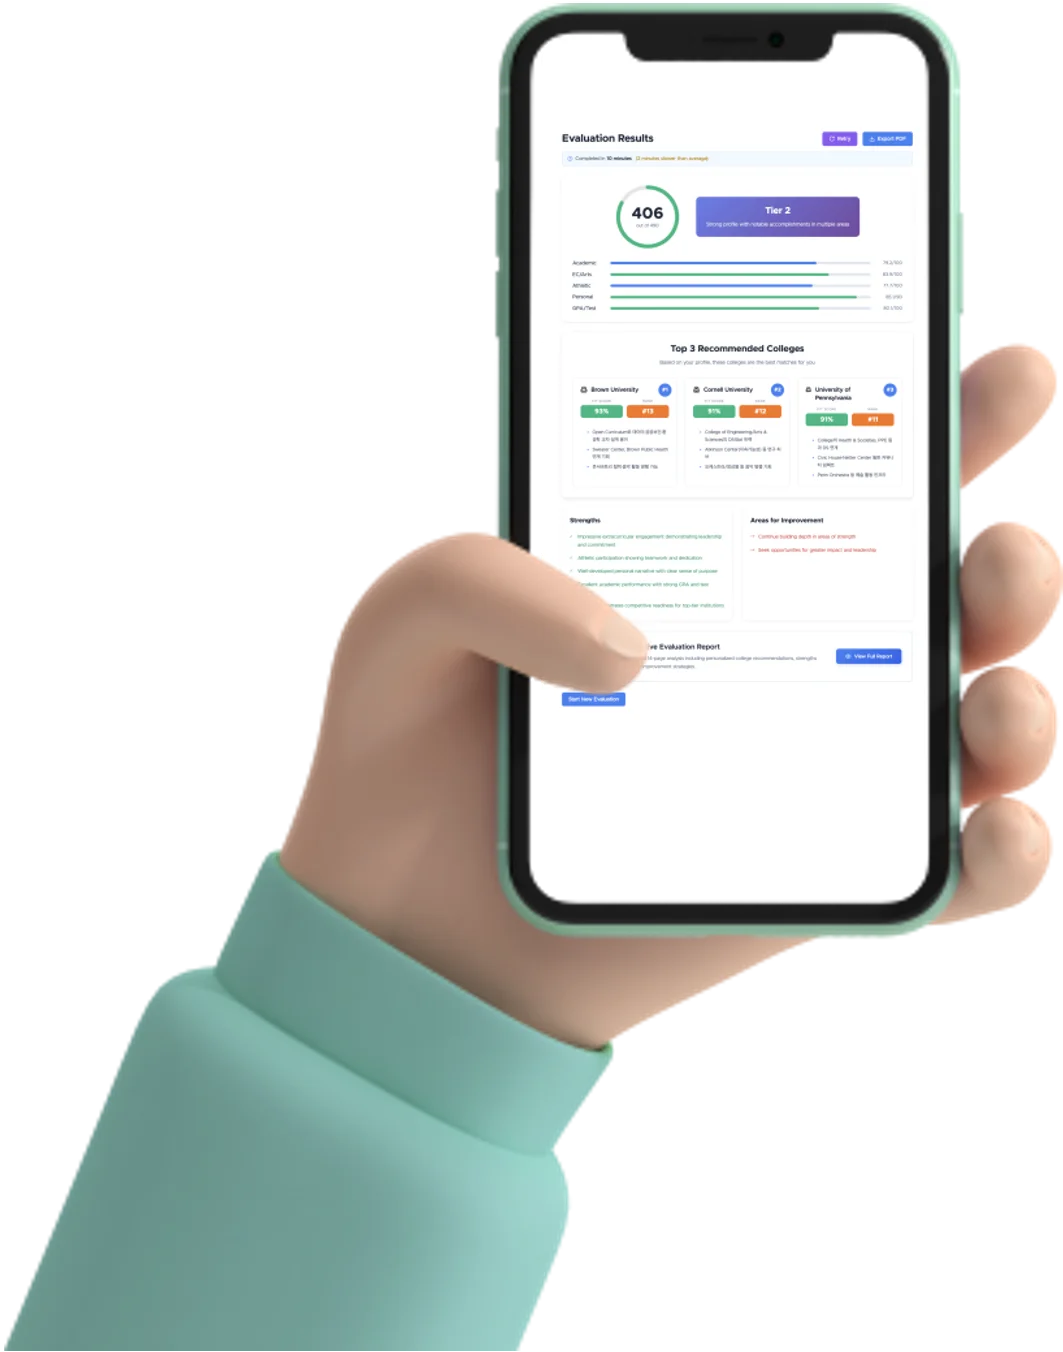
Use this page to turn recommendations into a focused shortlist and a practical plan. The three cards surface schools that align most closely with your current profile; read the one-line angle and the supporting sentence to understand why each match makes sense, then use Profile Fit to compare at a glance—remember, it reflects alignment, not a guarantee.

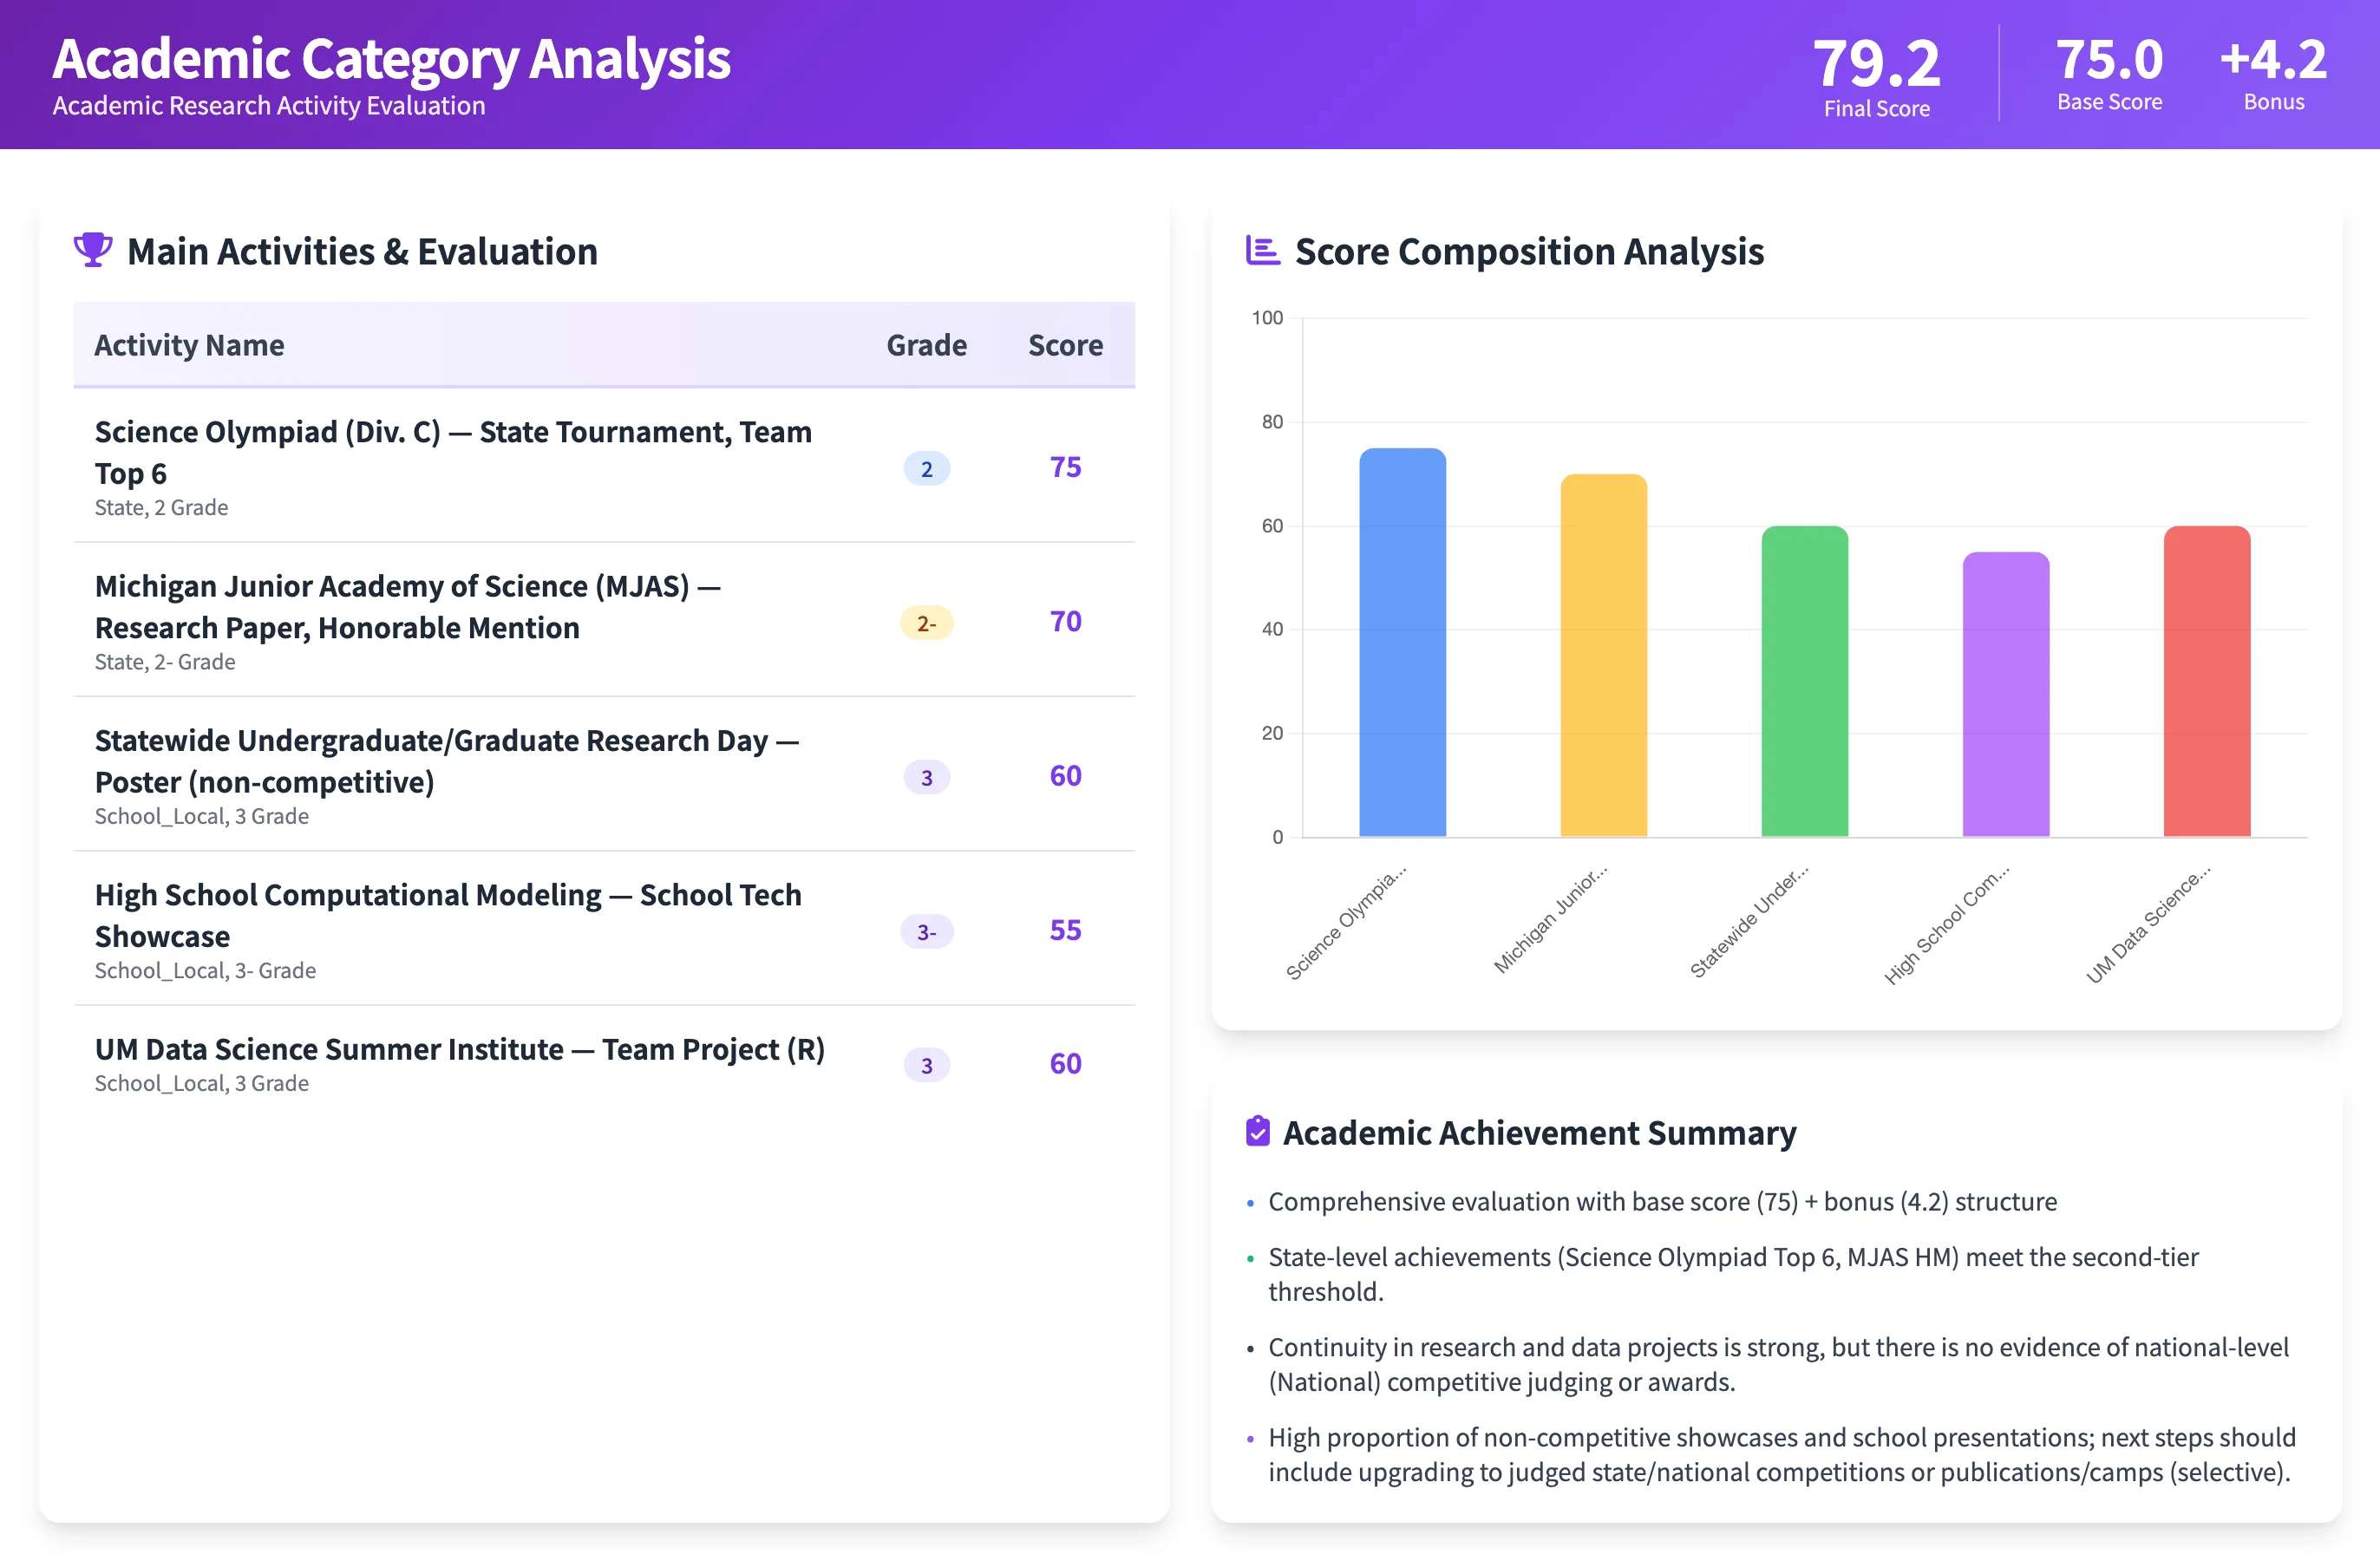
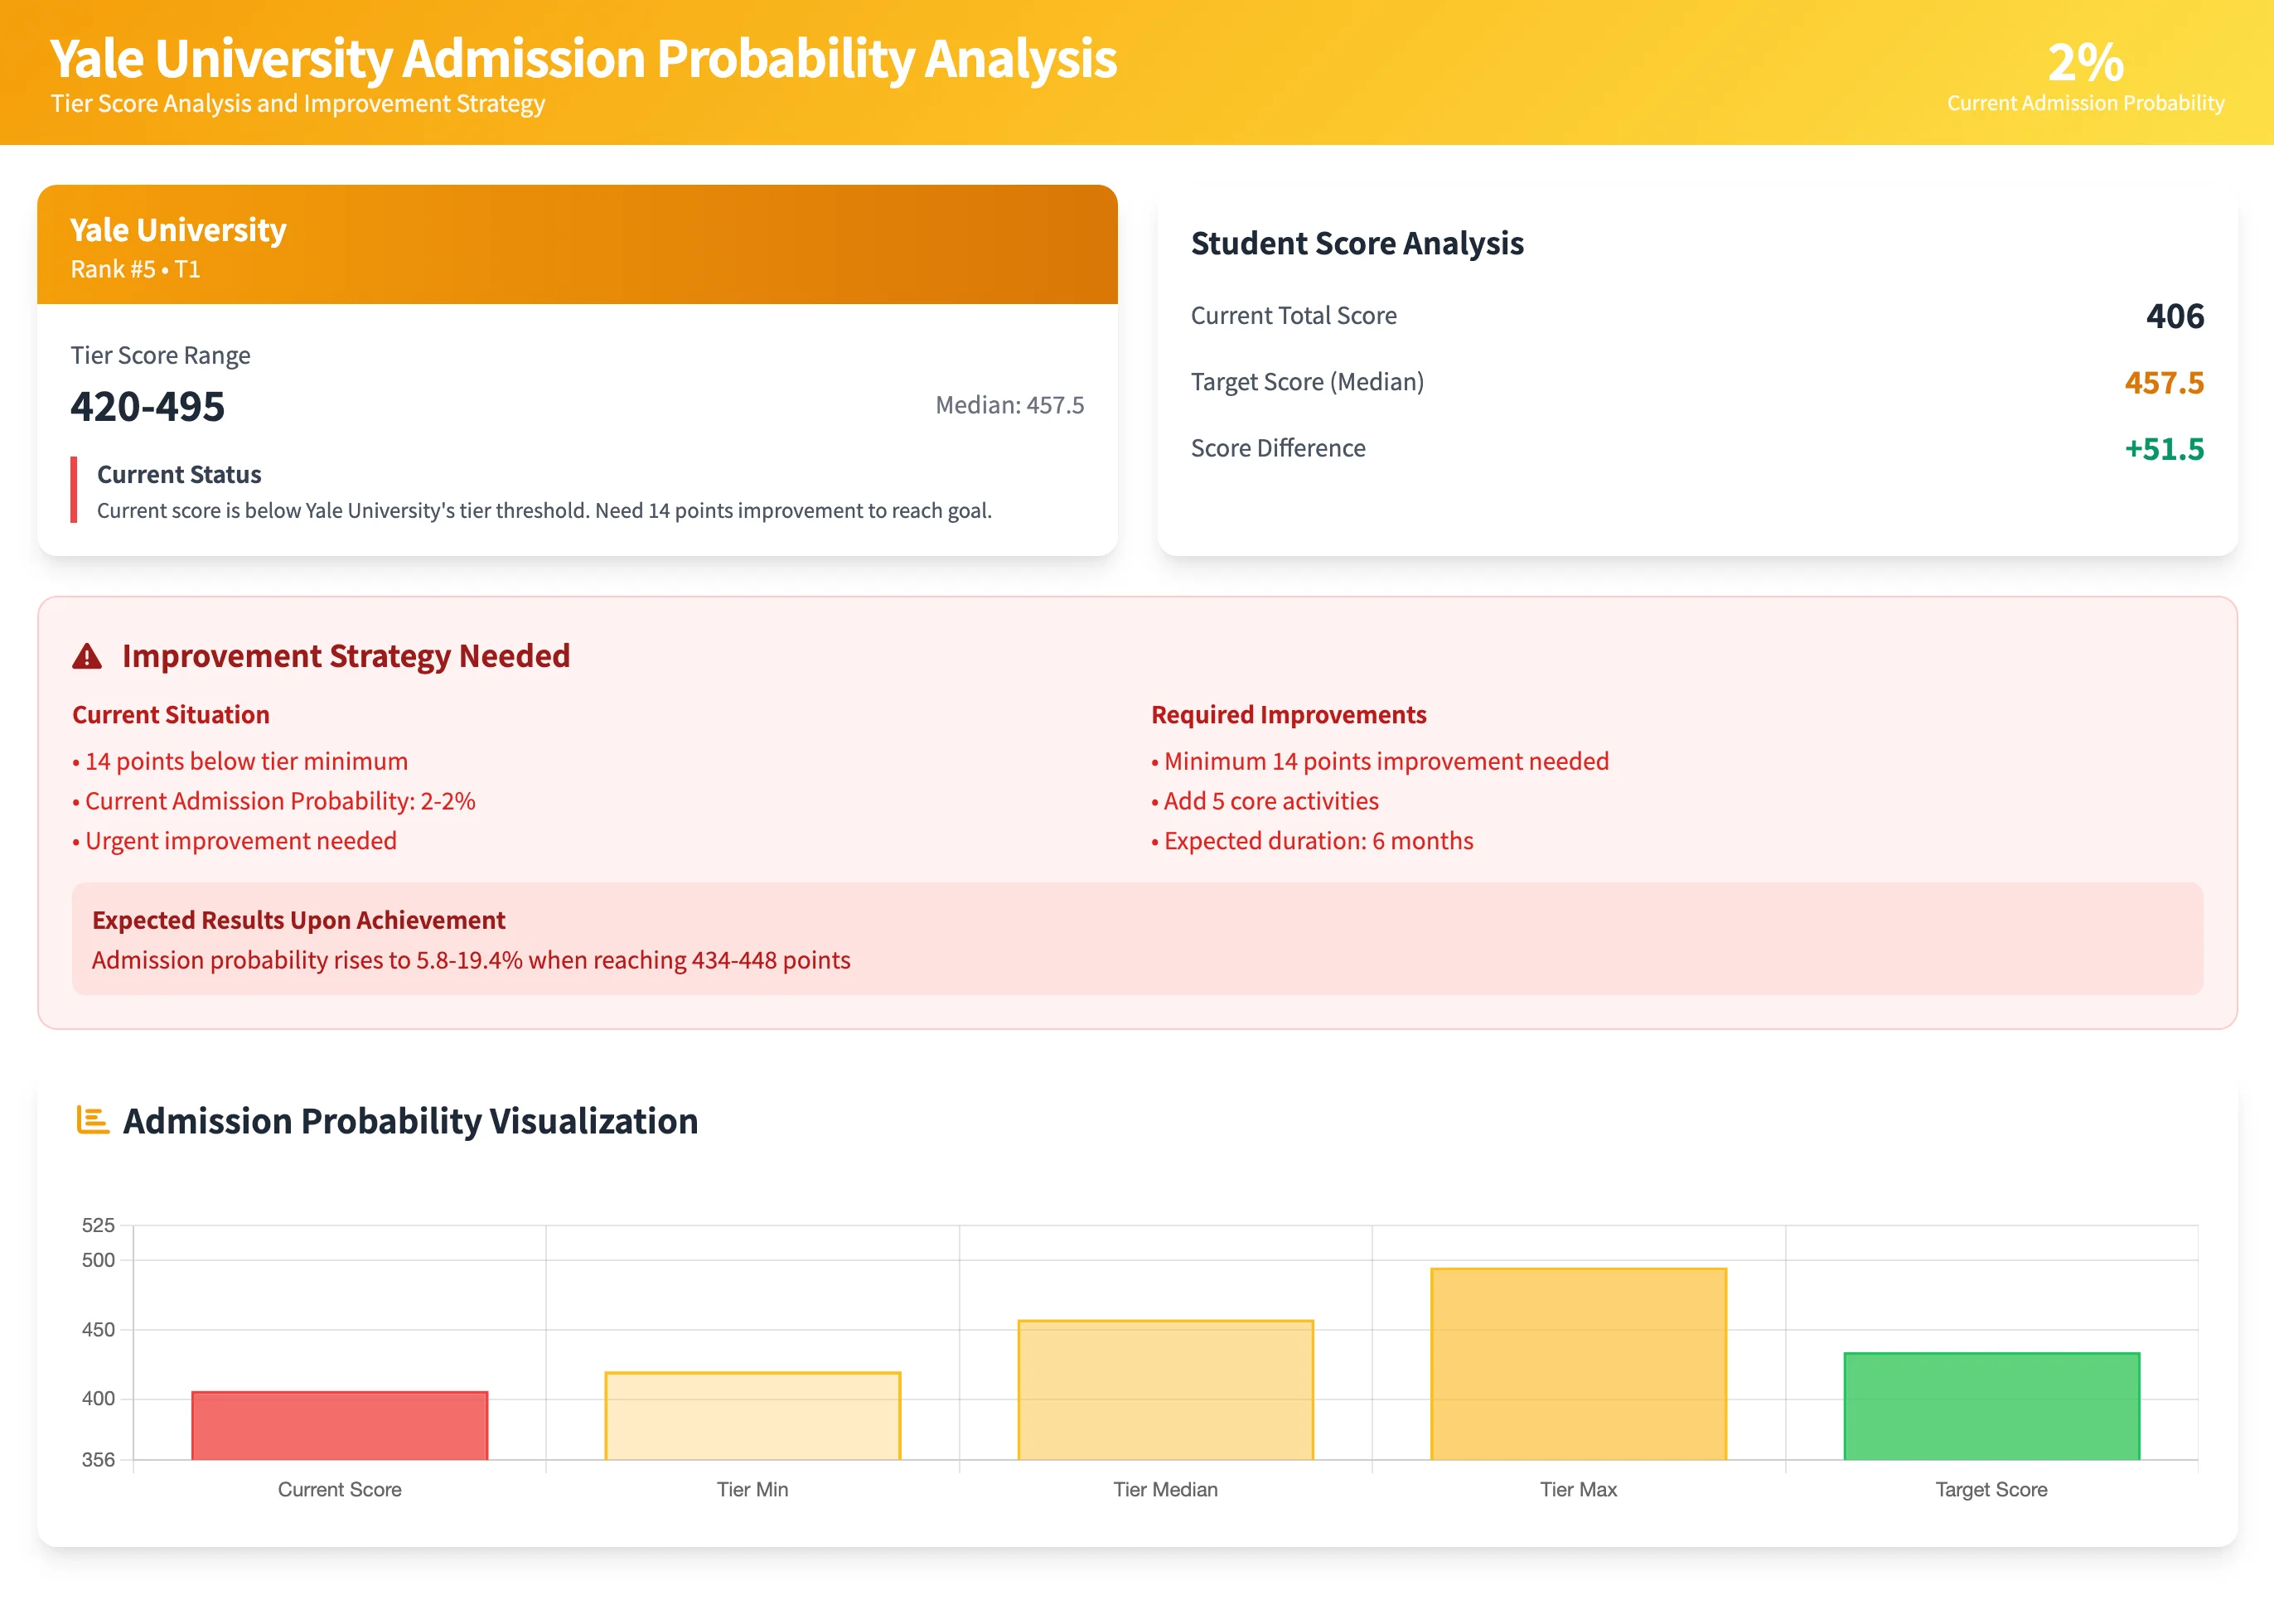
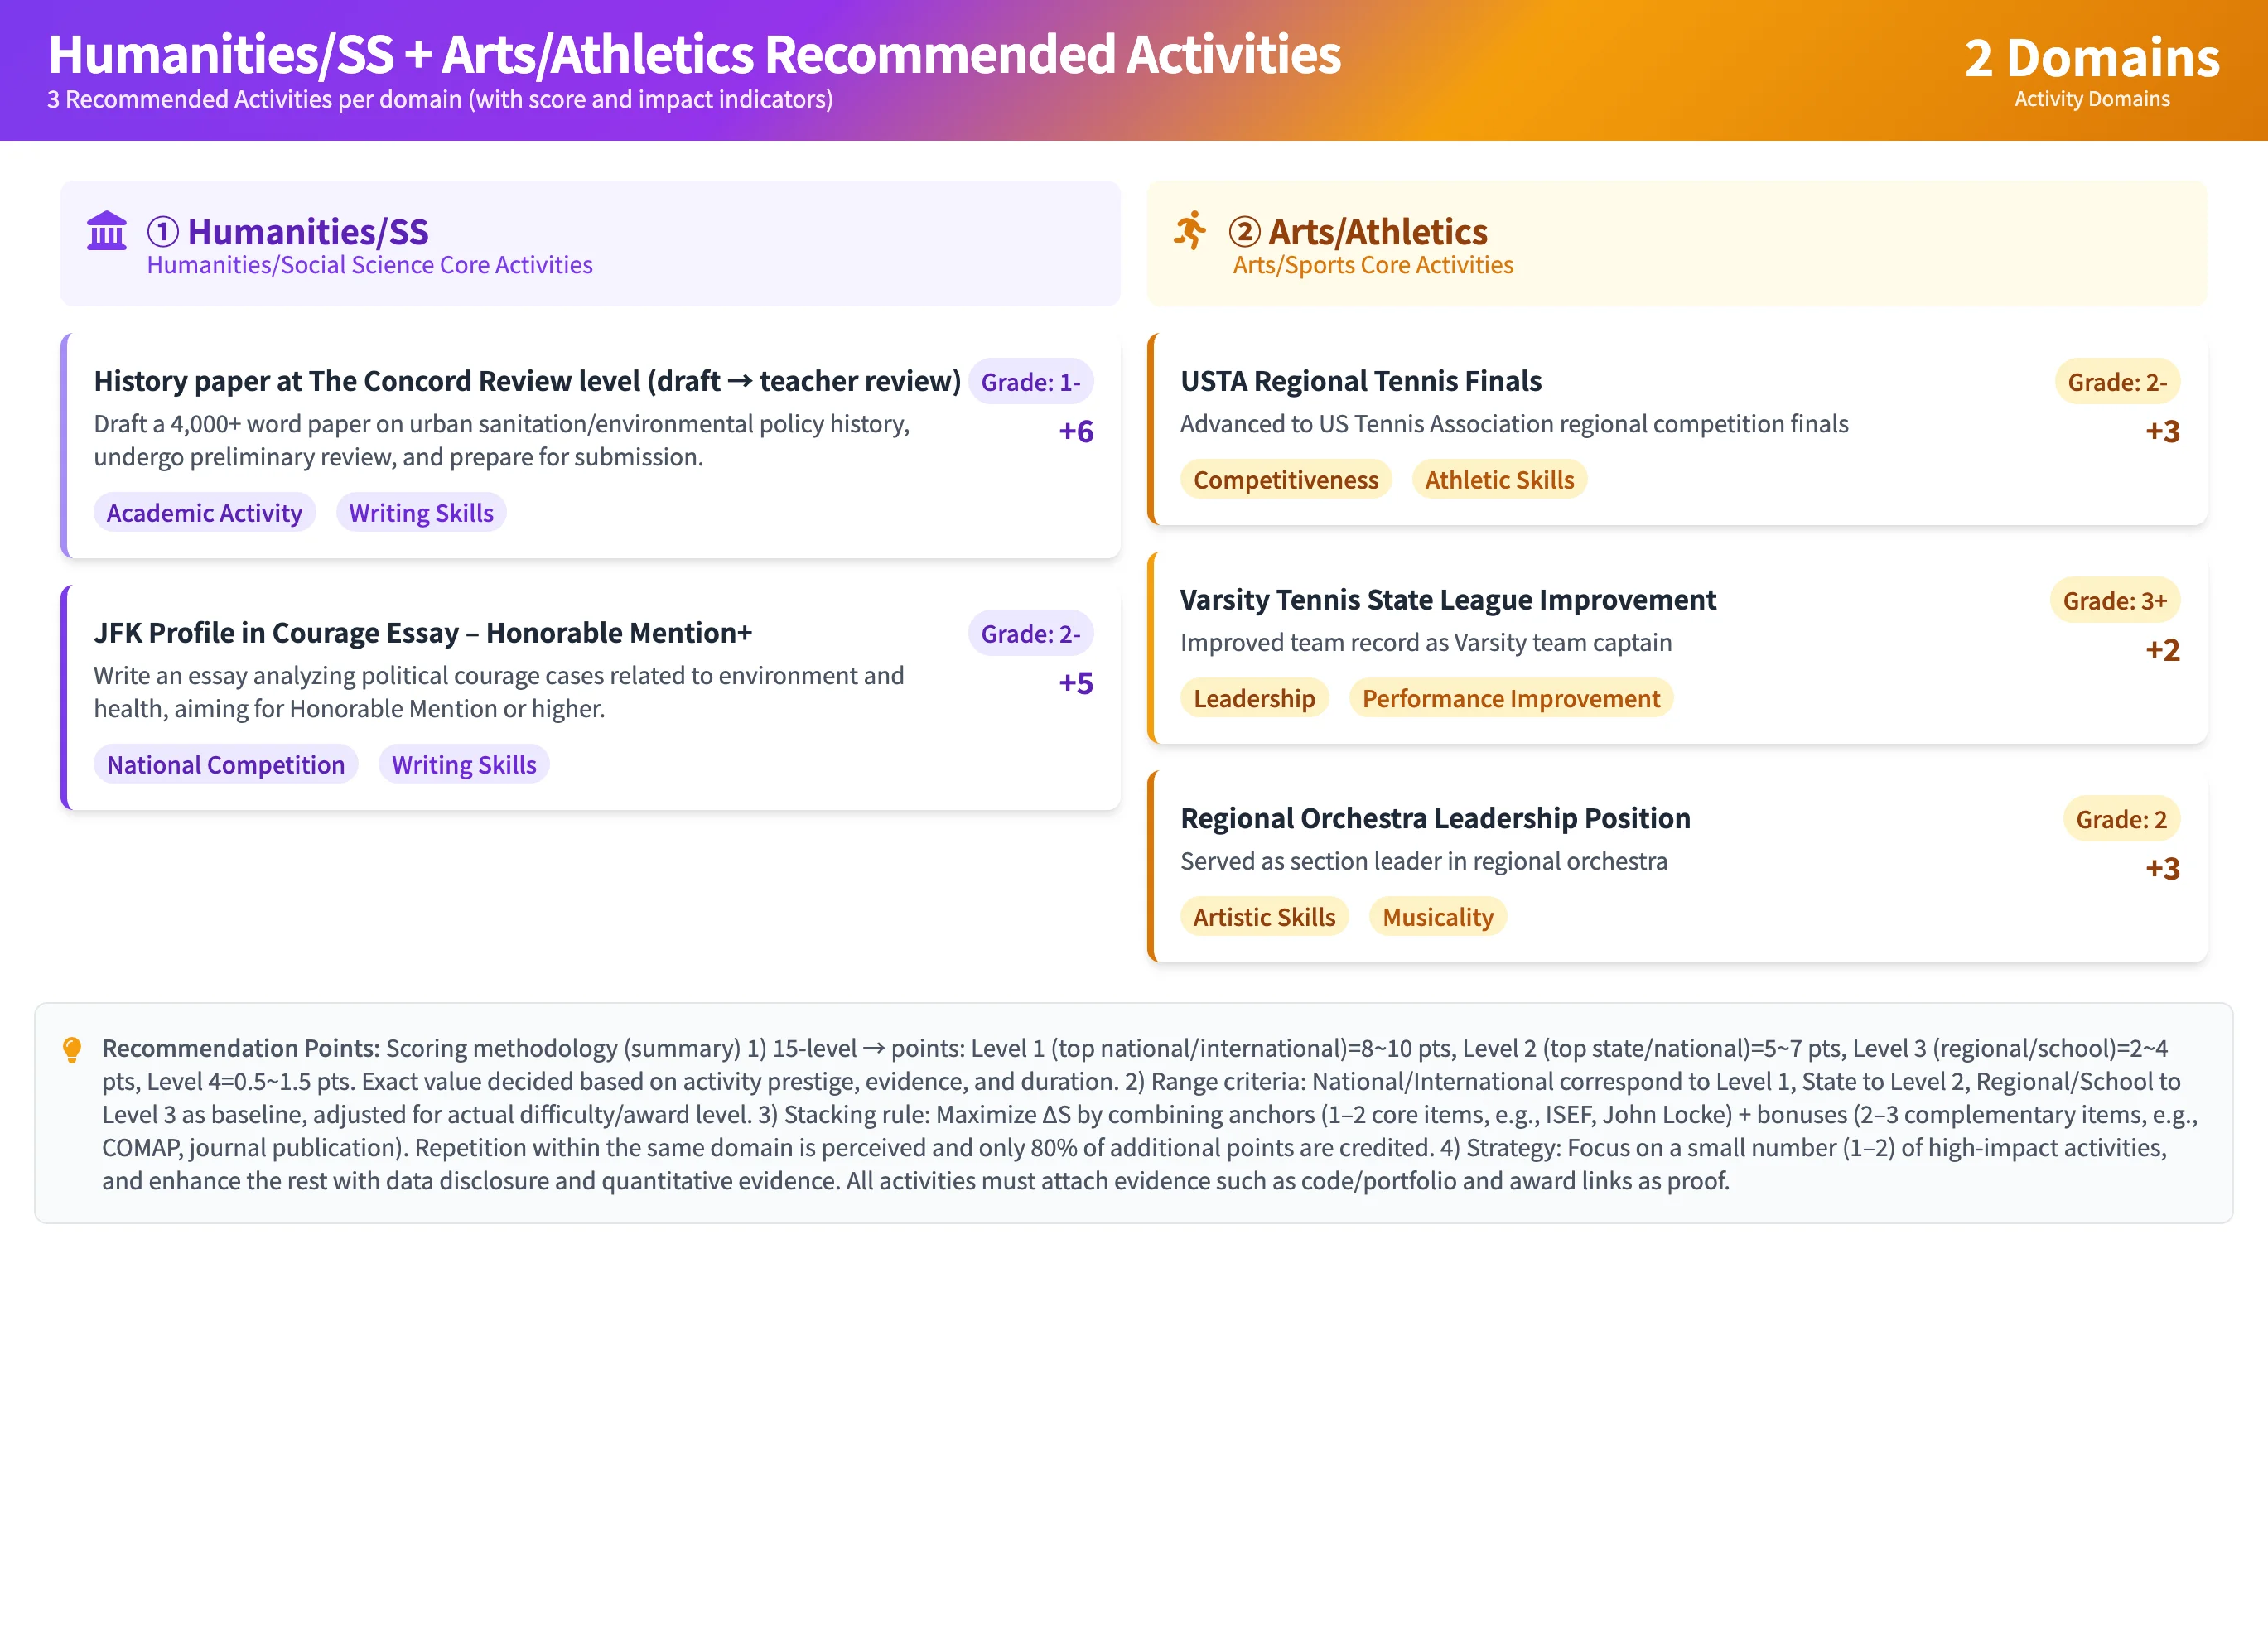
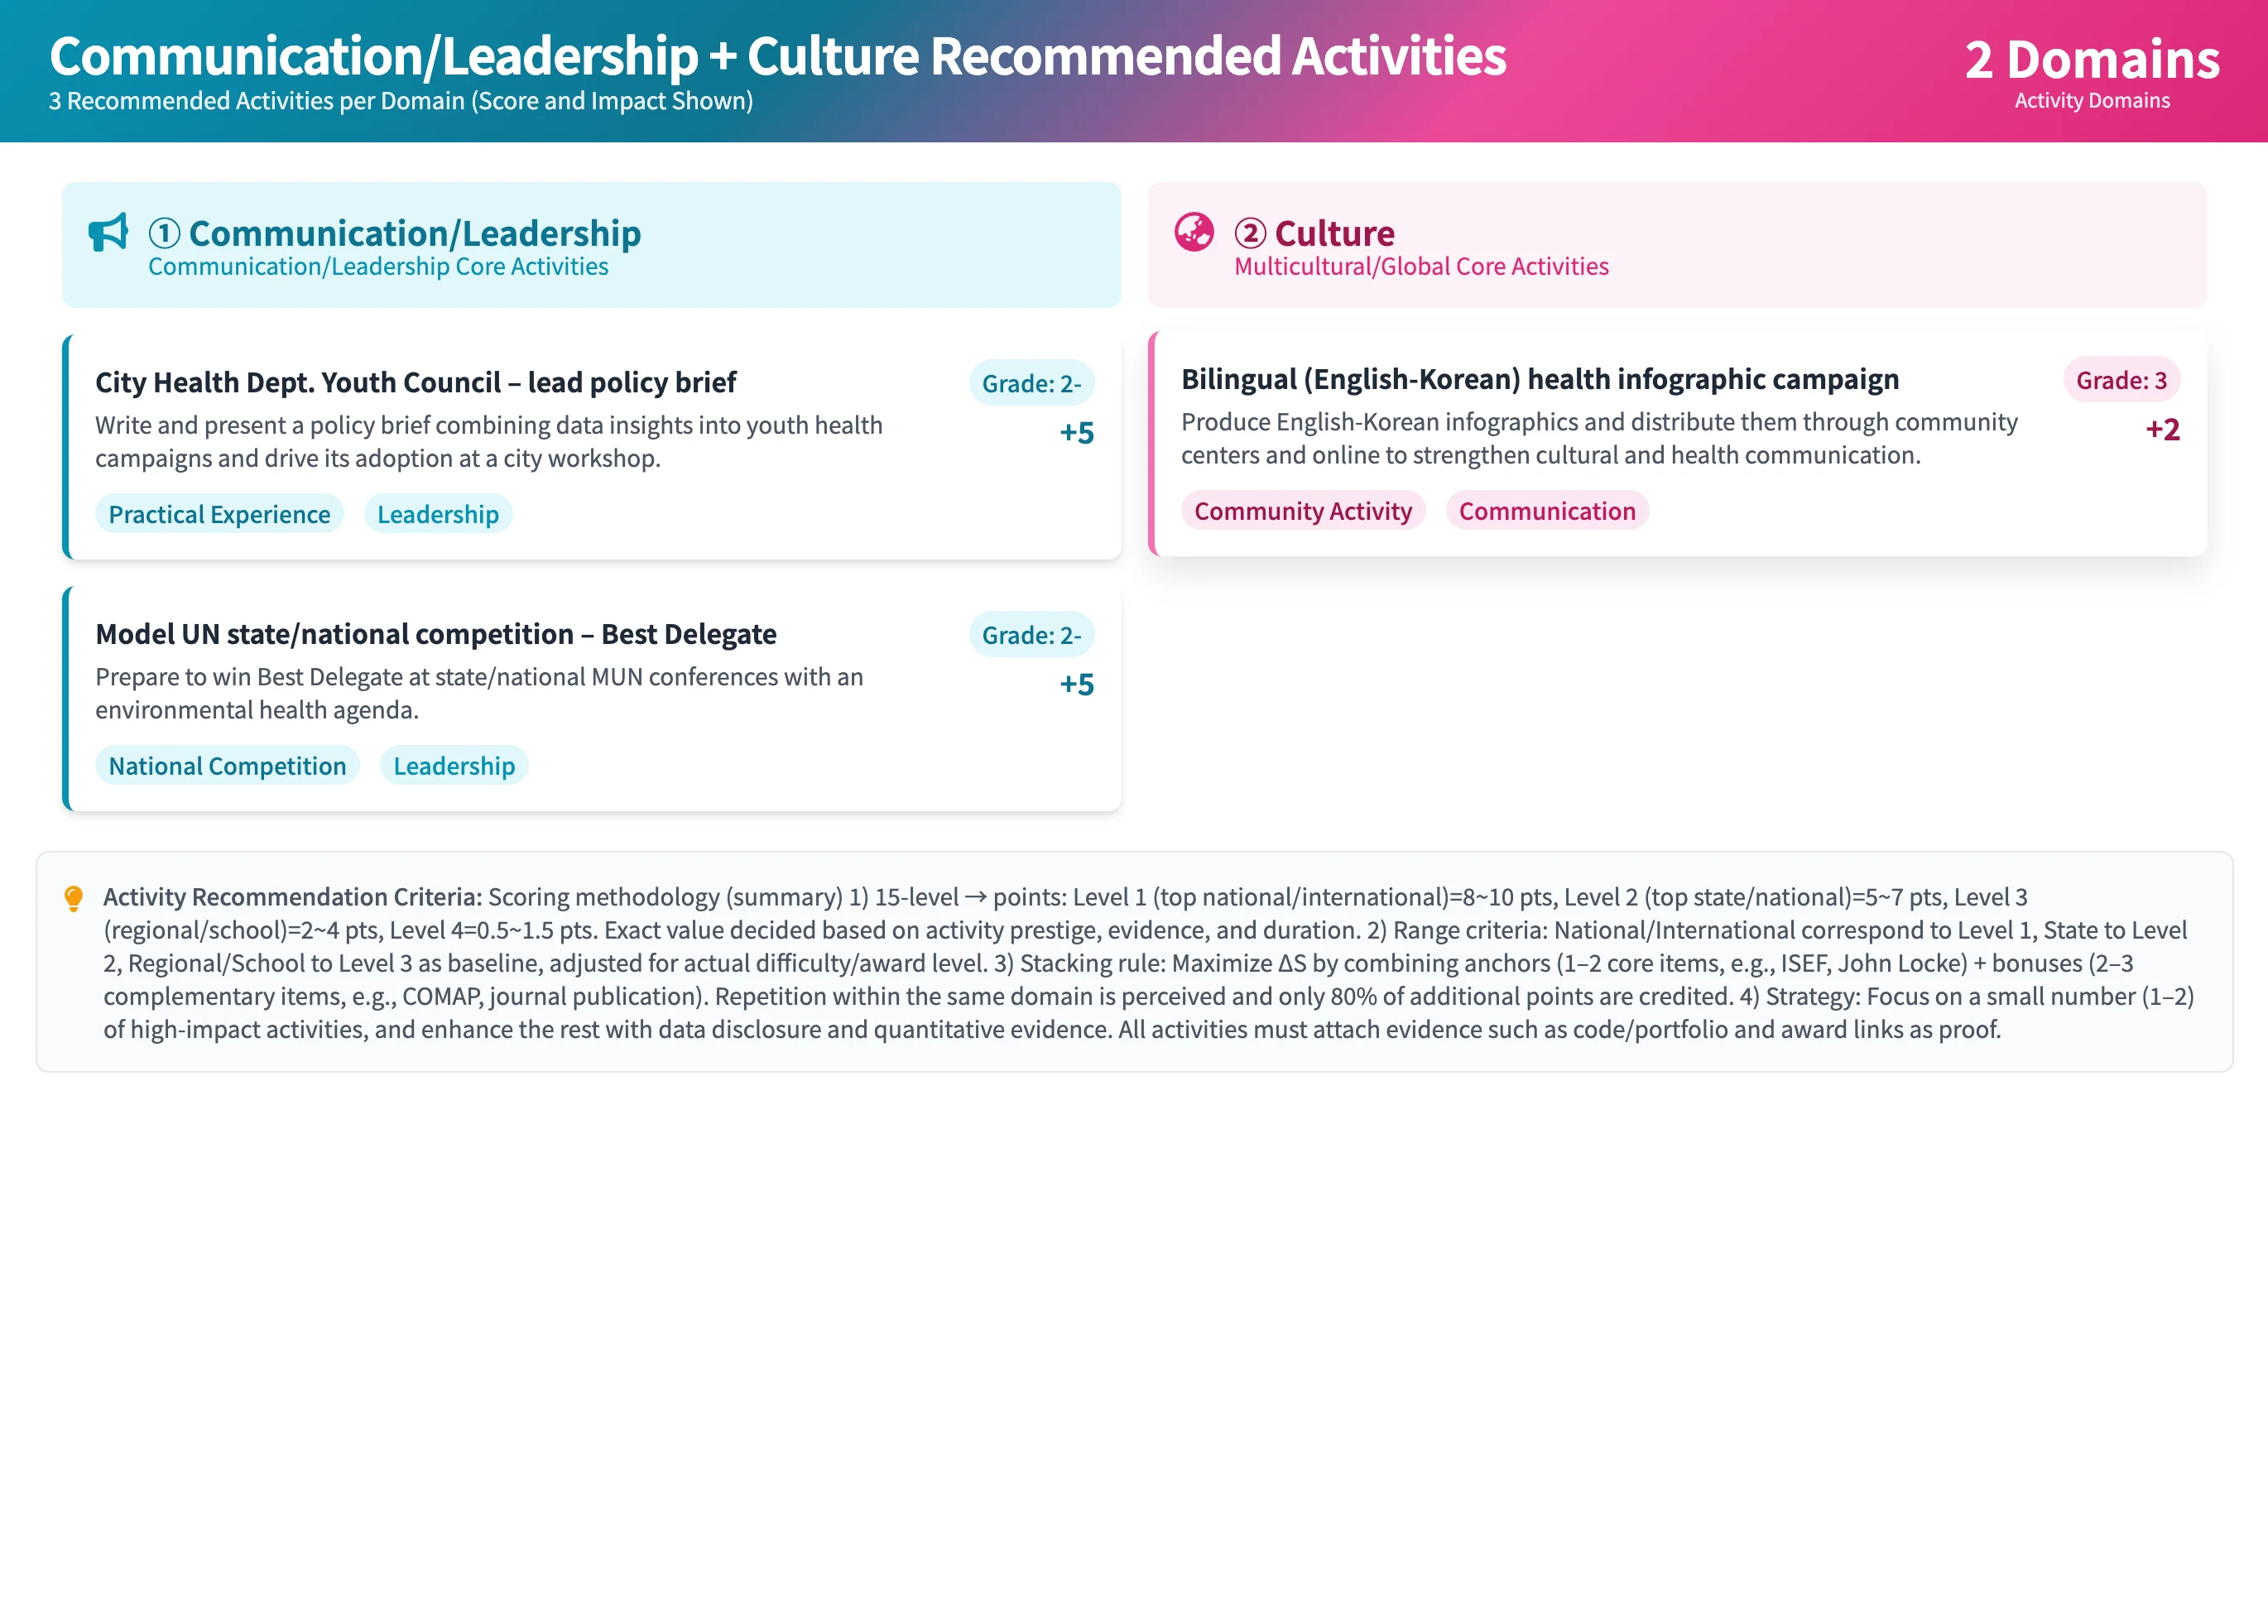
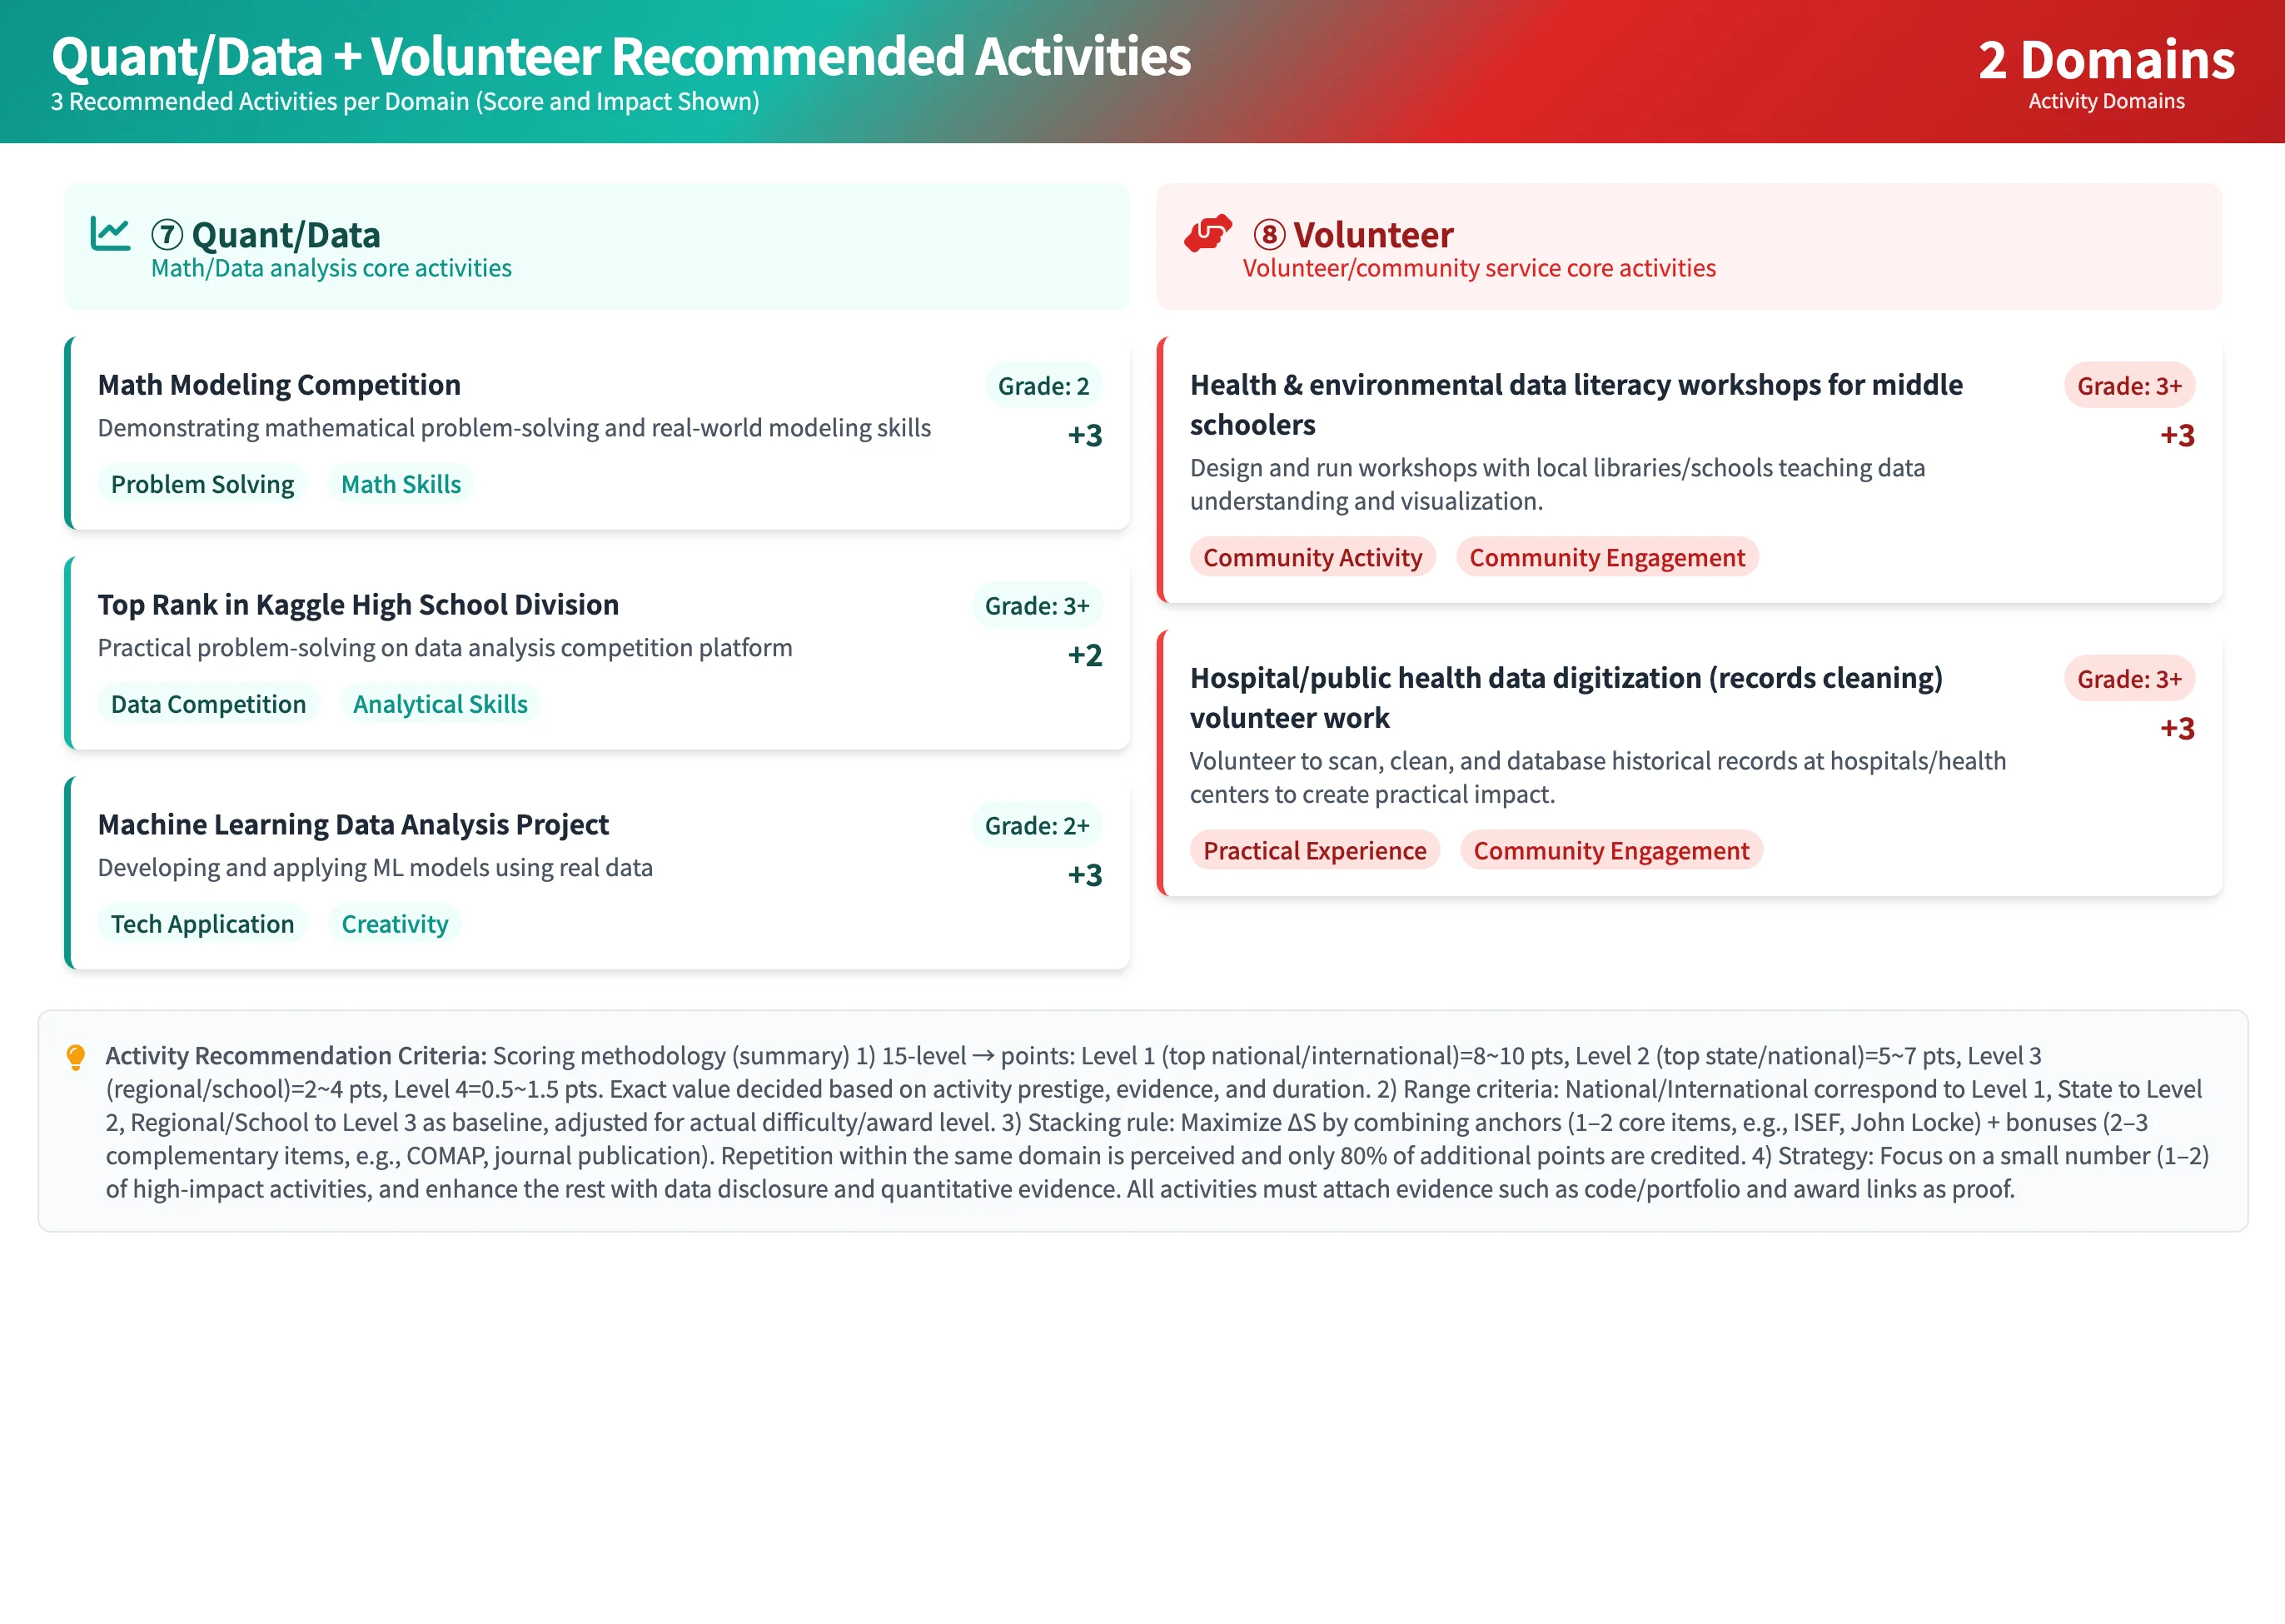
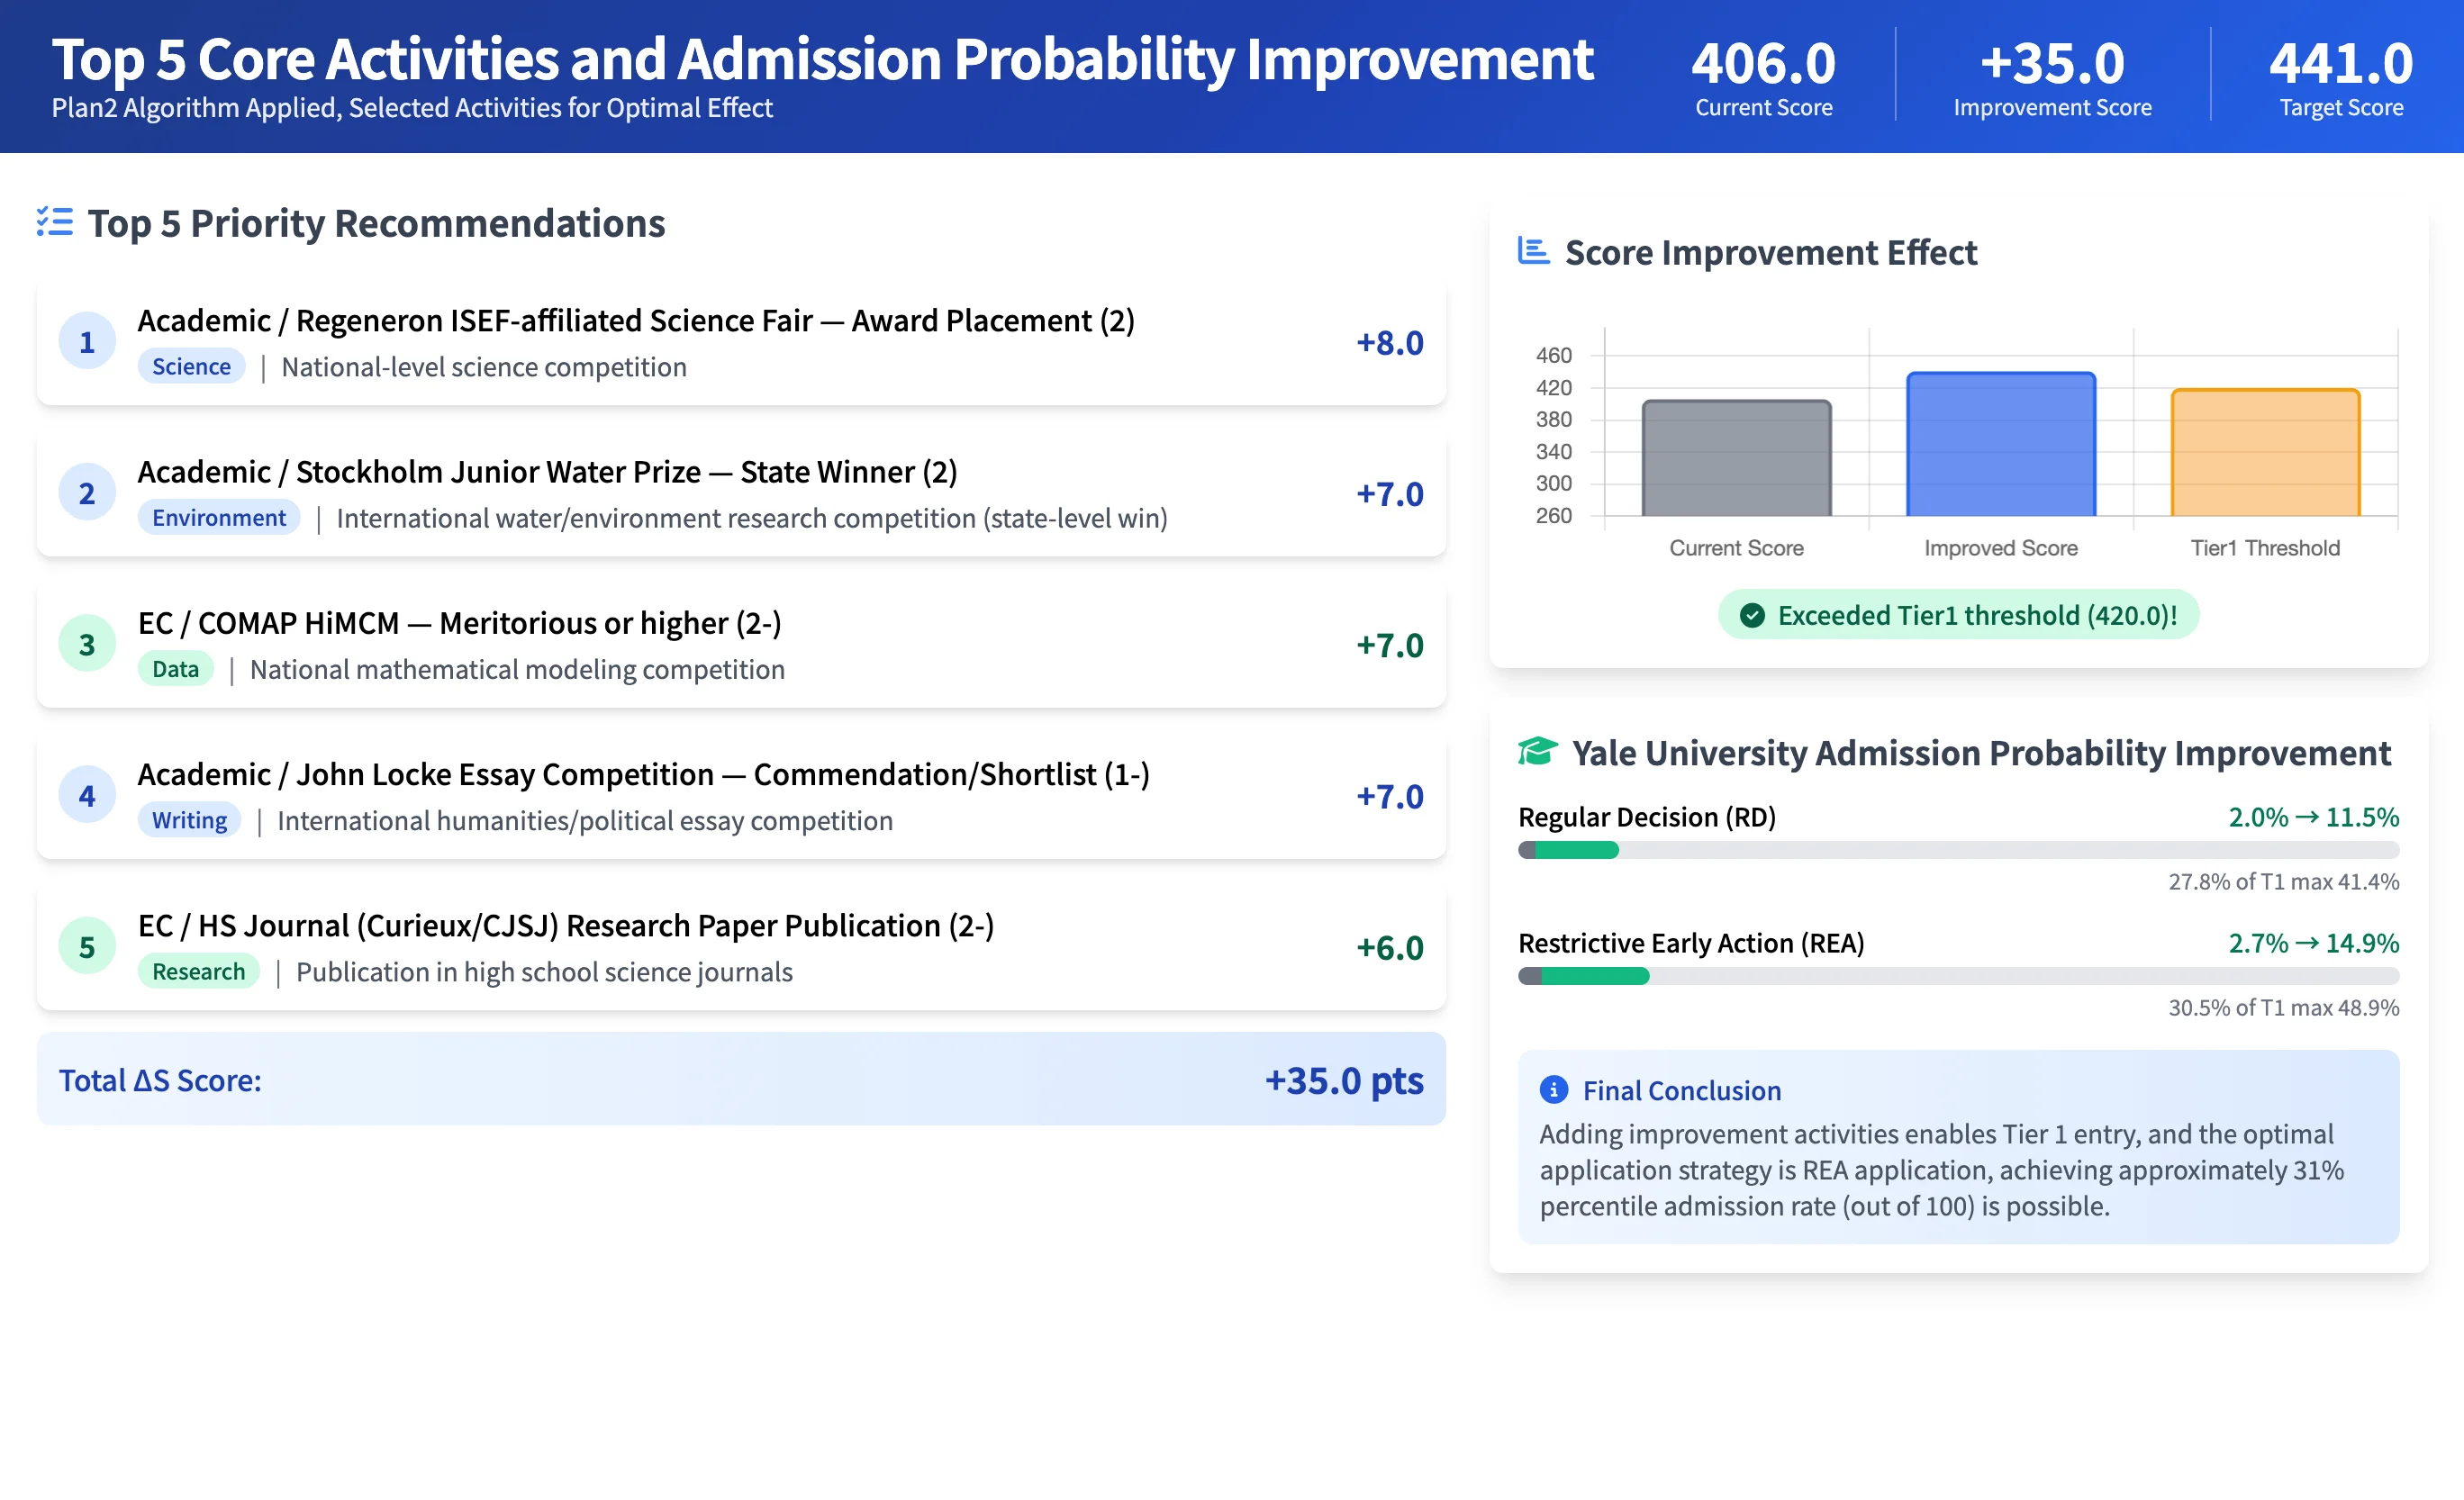
The Detailed Analysis Table converts that alignment into concrete levers you can act on—specific programs, centers, tracks, labs, and co-curricular opportunities mapped to your strengths and goals. It also adds context with Tier/Competitiveness and an indicative Admission Probability range so you can calibrate ambition and realism as you build your list.

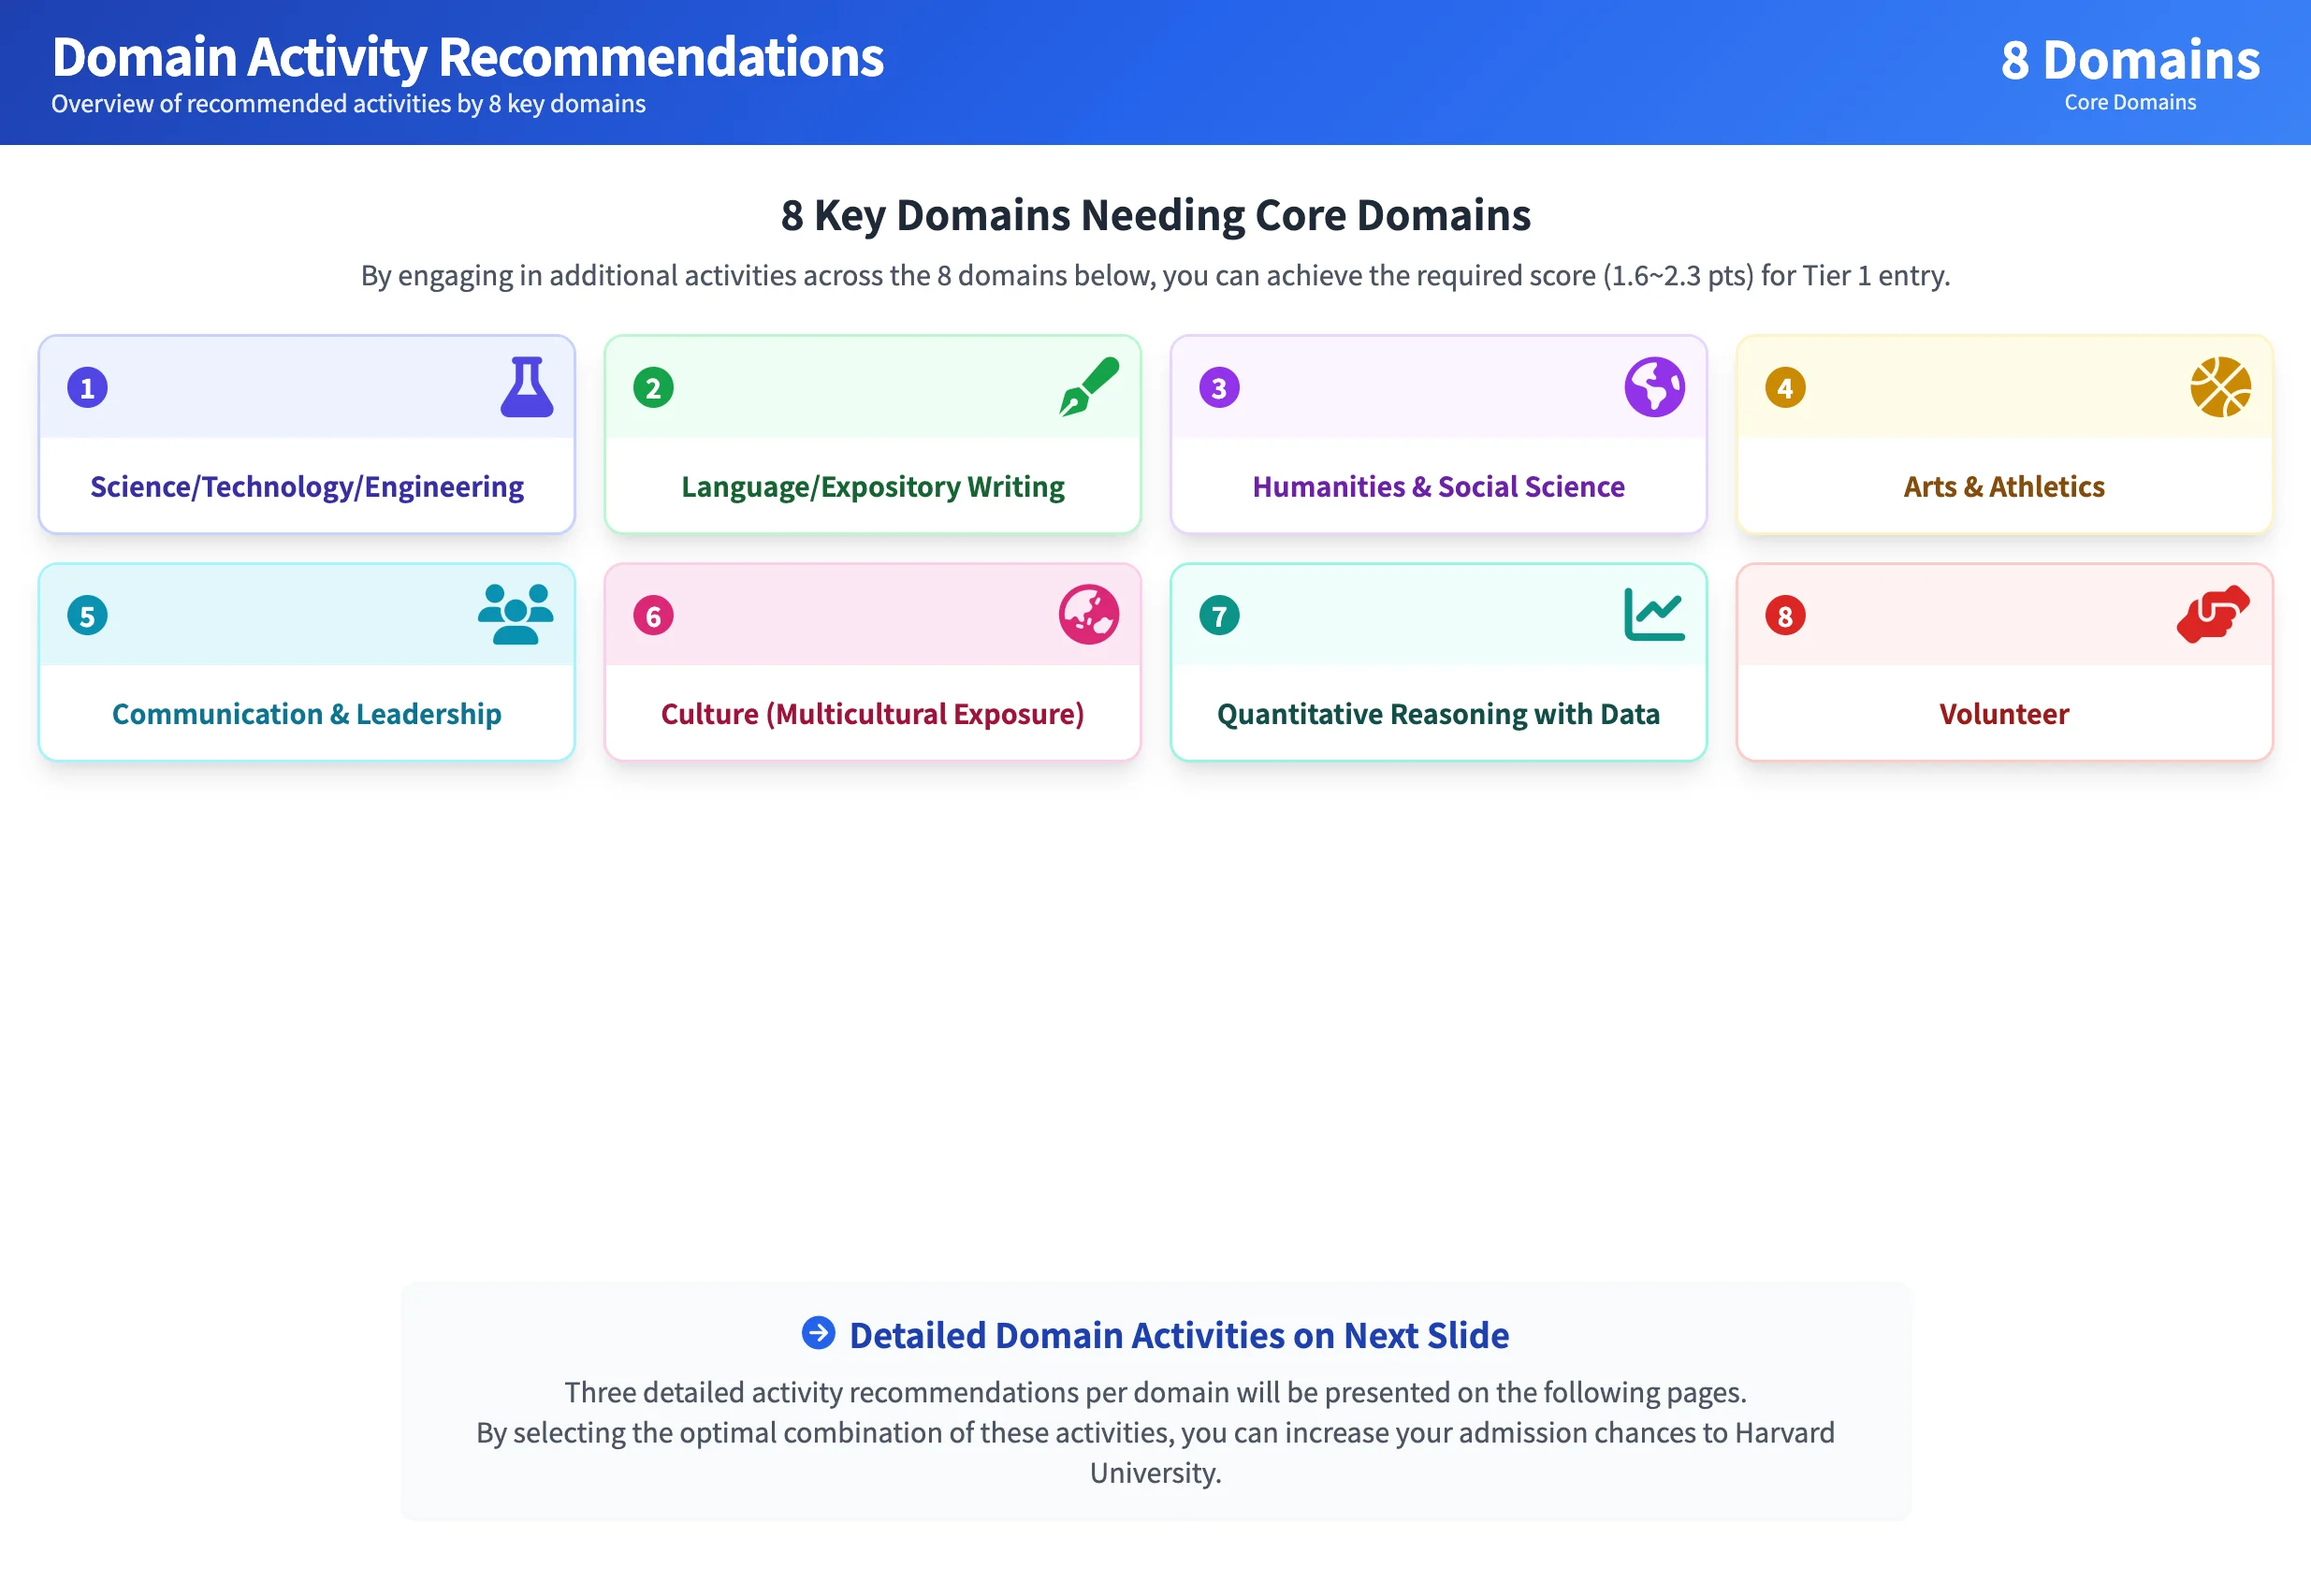
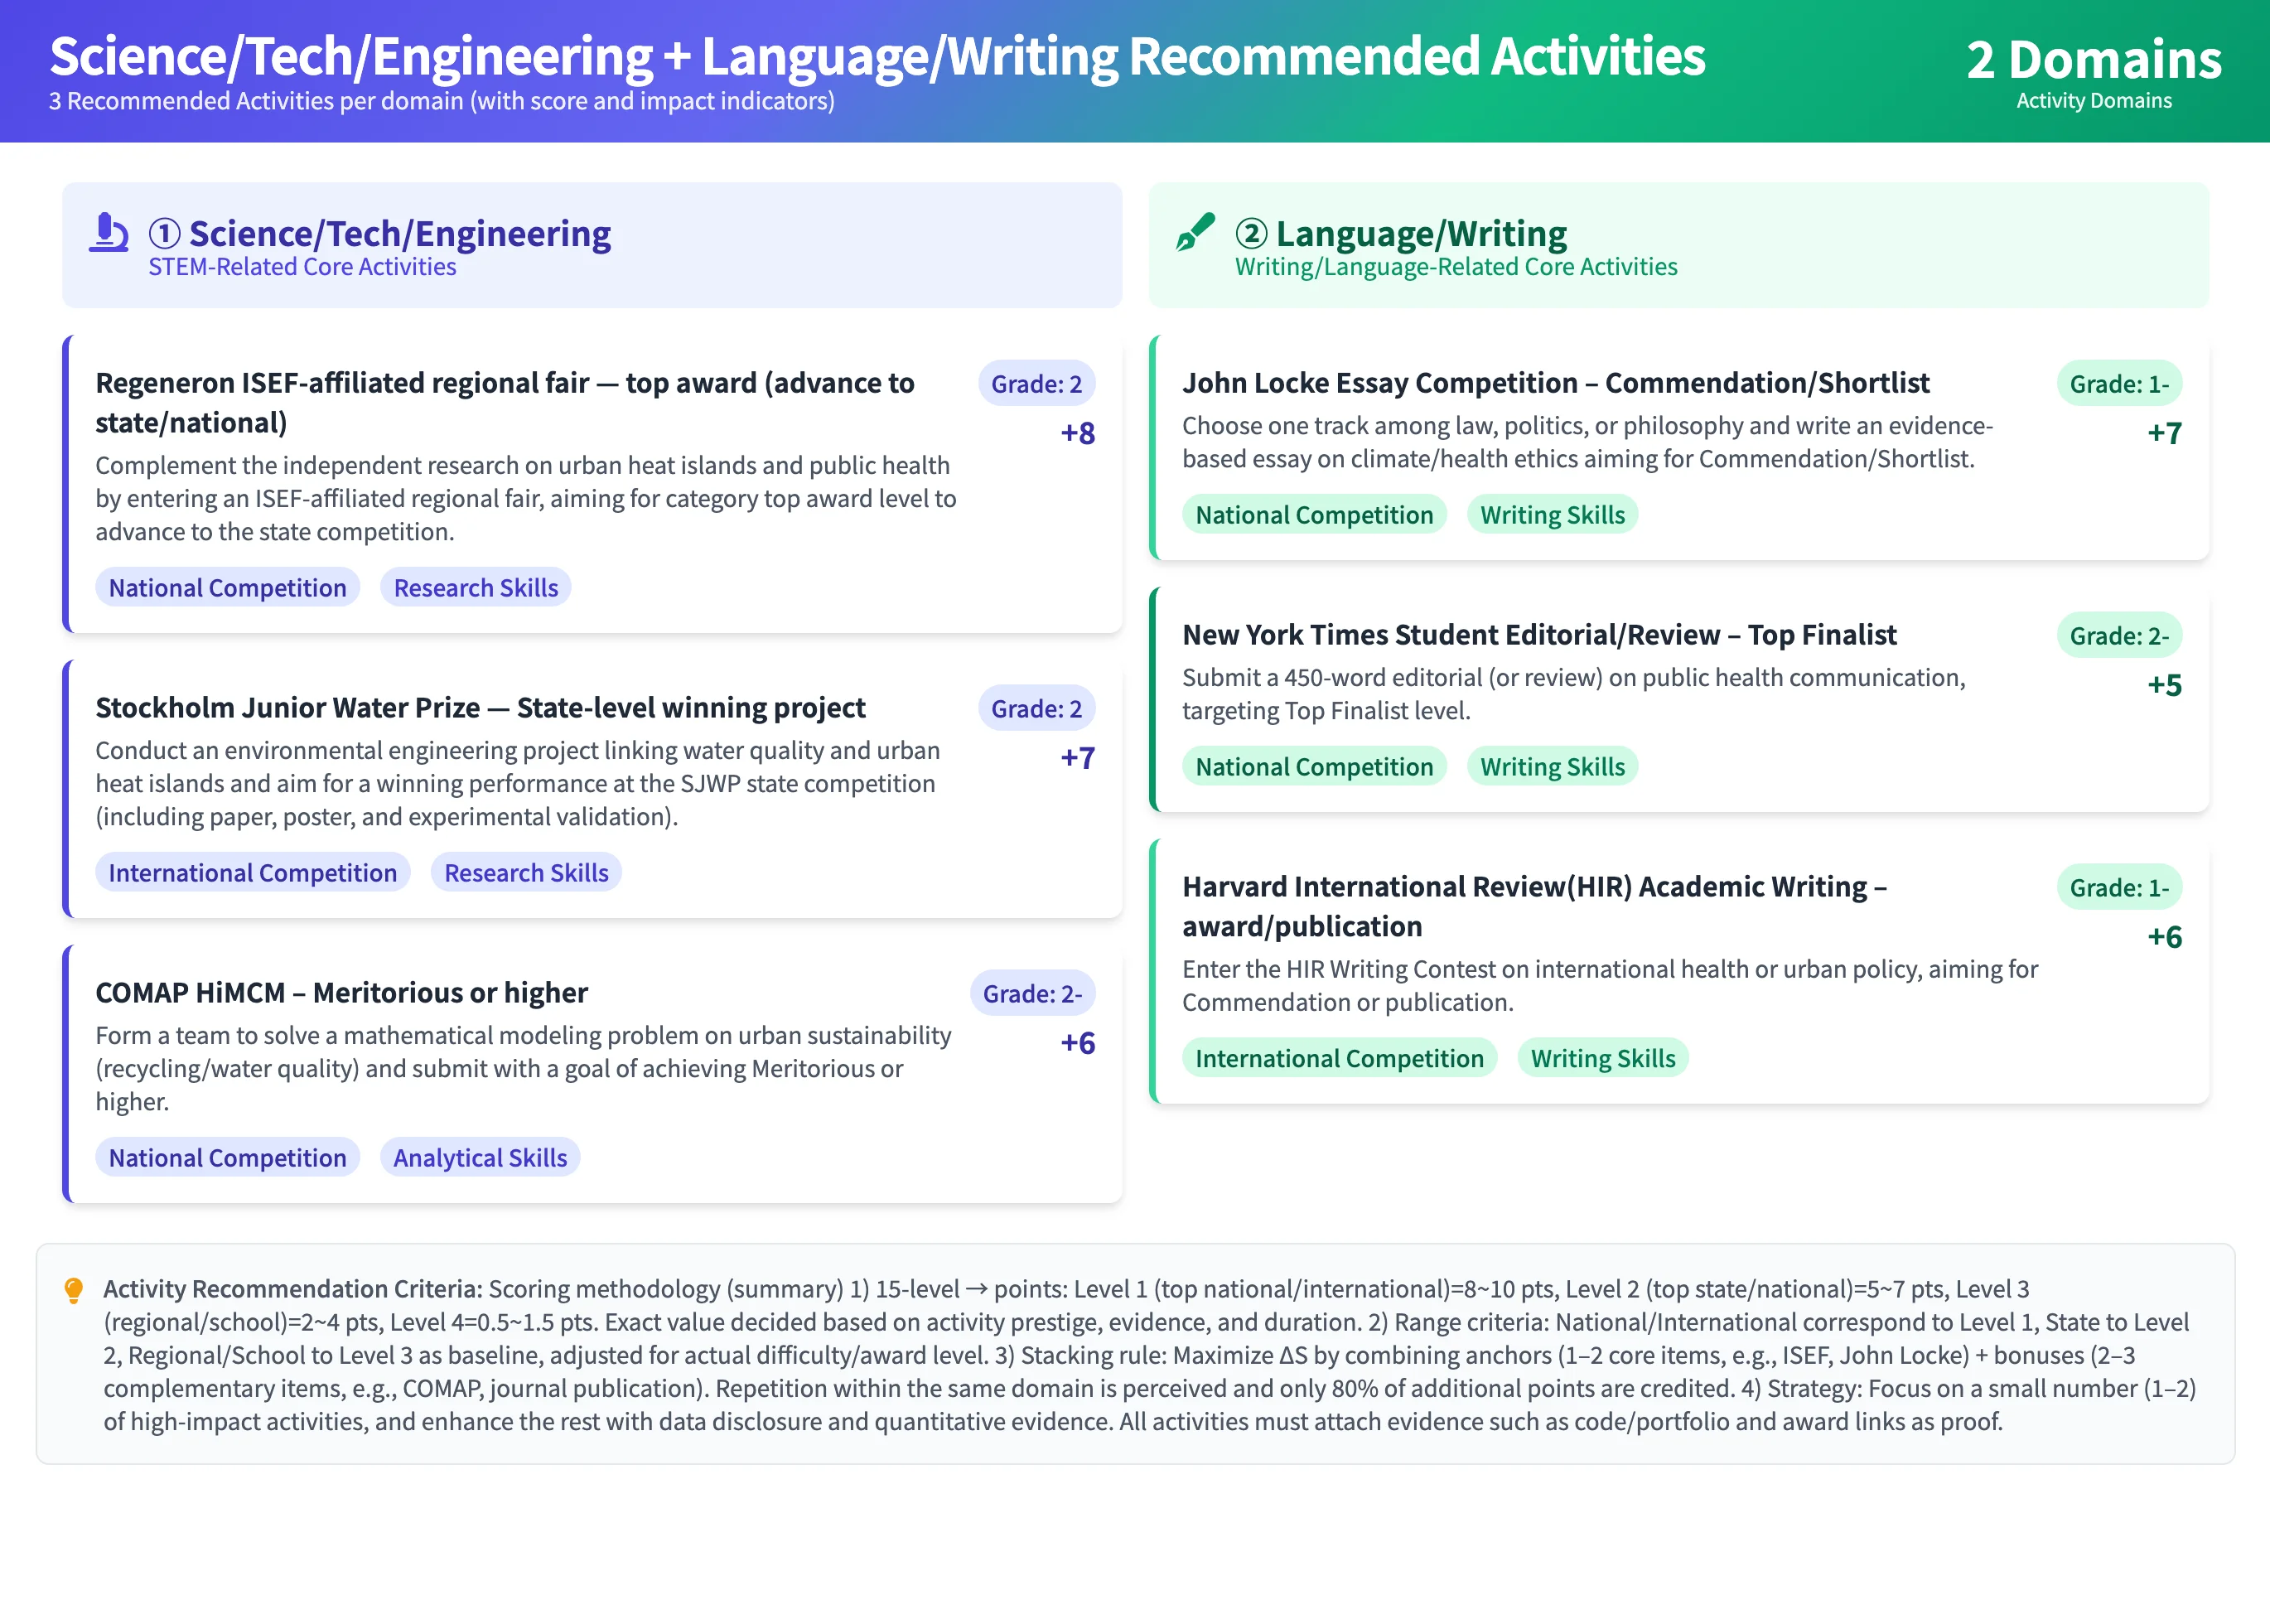
Start by keeping one or two schools whose rationale clearly echoes your strongest themes and intended majors. Open the linked resources to plan targeted steps—courses to prioritize, labs to contact, competitions or publications to pursue, and campus communities to engage. As you create verifiable evidence in those areas, your alignment improves, essays become easier to focus, and "nearby alternatives" in the same band become viable additions to your shortlist.

Admission Probability Icon

Admission Probability Analysis for Your Target College

This page estimates your current admission probability for the specific university you selected, using that school's Tier score range and median as reference points. On the right, you'll see your Current Total Score, the Target Score (median) for that school, and the Score Difference—the gap you need to close.

The Improvement Strategy Needed panel translates the gap into action: the minimum points to gain, the number of core activities to add, and an expected timeframe. It also shows the expected probability range once you reach the target score band, so you understand the payoff of improvement.

The Admission Probability Visualization compares your current score with the Tier minimum, median, and maximum, plus the target score. Use this chart to gauge distance at a glance and to prioritize steps that most efficiently move you into the school's competitive band. (Estimates are contextual and not guarantees.)

Target College Admission Probability
Domain Activity Icon

Domain Activity Recommendations

Domain Activity Recommendations

This page is your overview of the 8 key domains where additional activities can raise your score for the next Tier. Each tile represents a domain—Science/Technology/Engineering, Language/Expository Writing, Humanities & Social Science, Arts & Athletics, Communication & Leadership, Culture (Multicultural Exposure), Quantitative Reasoning with Data, and Volunteer.

Selecting a domain takes you to detailed recommendations. There you'll see suggested activities with a brief description, expected score gain, typical resources and time horizon, and the type of evidence to produce when you're done.

How to use this page: choose two or three domains that align with your intended major and address your weakest axes. Prioritize activities that create clear proof—outputs, awards, leadership, or published work—so improvements show up in your score and Tier. Estimates are directional; depth and execution determine the actual impact.

Core Activities Icon

Top 5 Core Activities & Admission Probability Improvement

Top 5 Core Activities Dashboard

This page turns strategy into a concrete plan.

On the left, the Top 5 Priority Recommendations list the highest-impact activities for your profile, with brief context tags and an expected score gain for each; the blue bar at the bottom totals the projected ΔS Score. On the right, Score Improvement Effect visualizes how those actions move you from the current score to an improved score and past the relevant Tier threshold.

The Admission Probability Improvement panel translates that score lift into application strategy, showing how Regular Decision and Early programs change under the improved scenario. Finally, the Conclusion summarizes the recommended path—e.g., which application round to favor—and the approximate percentile you could reach if you complete the activities at the suggested level. (Estimates are directional; actual impact depends on depth and verifiable outcomes.)

Now, it's your turn.

Ready to turn clarity into progress?

Turn potential into a plan: upload one PDF, see exactly where you stand, and follow focused next steps that raise what matters most.

Lead with your strengths, then add high-impact activities that create real evidence—awards, publications, shipped projects—so gains show up in your score and Tier.

Small, consistent moves compound—start today and watch "maybe" turn into "ready."

Desktop evaluation report Mobile evaluation view
Jaden K., 11th grader, Seattle
I'd been collecting random clubs. This showed me two domains to double-down on and a concrete project idea. I actually finished a small research brief in three weeks.
Thumbs up
Hannah P., 12th grade, Toronto
It connected my robotics work to data storytelling. I pitched a column to the school paper and used it as proof.
Priya M., parent, NY
Great for parent-student alignment. Now we're looking at the same data—not just guessing.
Maya R., senior, New Jersey
The strengths line basically became my thesis statement. I dropped three half-baked topics and built one focused narrative that matched the Top 3 rationale. Drafting was faster because I knew exactly which examples to highlight.
Emoji
Mr. Han, parent of a senior, California
We uploaded a revised resume a month later and the weak bar moved. That visual made the effort feel worth it.
Trophy

Frequently Asked Questions

What to expect, how to use it, and what comes next.
Didn't find what you were looking for? Email us at [email protected].